DAQ Plot ► Overview ► Major Components
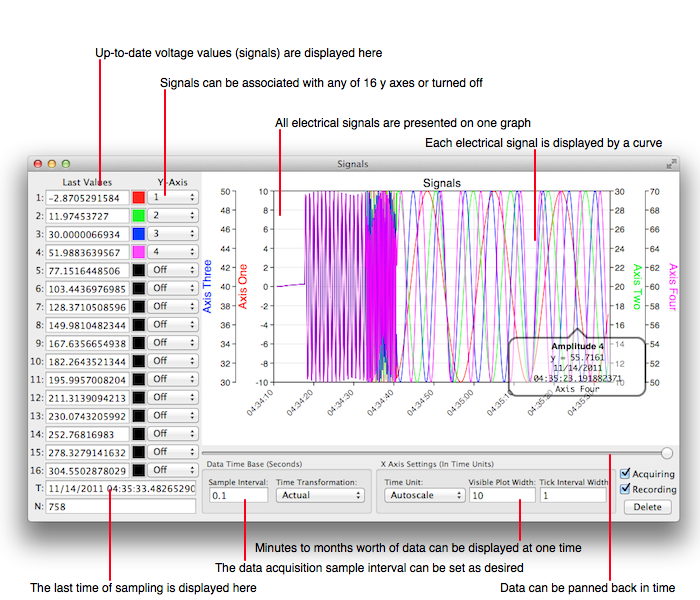
When you launch DAQ Plot it first shows a signal viewer (a.k.a. a strip chart) as shown in the following diagram. That viewer shows up to sixteen separate signals acquired through various sources, namely Hardware. Signals are displayed as as curve of amplitude vs time and also a numeric value of the last value acquired. The signal viewer also includes controls that are defined below.
Other controls appear in the Preferences panes.
The following details each control on the main window.
Amplitude Display
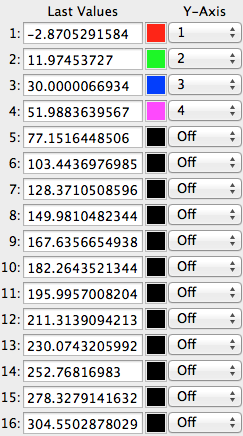 | These settings control the display of amplitudes (see Glossary for a definition of amplitude). Each column is described from left to right. Each amplitude is given an index from 1-16. The last value shows that amplitude's last value collected. The color well shows and helps change the color of the associated curve. The Y-Axis pop up button defines which y-axis is associated with the amplitude index and is used to select a number from 1 to 16, or Off is the amplitude is not to be displayed. |
Current Seconds And Index
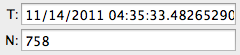 | Shows the value of the last sample time and its sample index. |
Recording States
 | Turn on the Acquiring switch to acquire data. Turn on the Recording switch to record that data. Click the delete button to delete previously recorded data. |
Scroll Bar
 | The scroll bar defines the number of ticks scrolled back in time. This does not have a valid affect when the x-axis is autoscaled. |
Graph Tick Settings
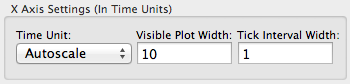 | The tick settings define the number of tick intervals displayed on the graph, the date-unit length of each tick interval and the tick unit type. |
Time Base
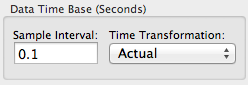 | The time base defines the time-discretization of the signal. The Sample Interval defines how many times per second values are sampled, or more appropriately, the seconds between sampling. The Time Transformation button controls whether the gaps, which happen when recording is off, are displayed or if those gaps are not displayed thus forming a contiguously on display (hence the name).
If a device is in segment-mode (such as for hardware clocking) then the Sample Interval represents the speed at which the user interface is updated and not the sampling time of the actual data. |