The Density Task takes a sequence of scalars and presents them as boxes on a uniform 3D grid. The scalars have values between 0 and 1 and any value outside that range (especially -1) means "no density". By selecting Z Slice in the Preference tool the densities can be scanned in the z-direction one x-y plane at a time. Notice these peculiarities:
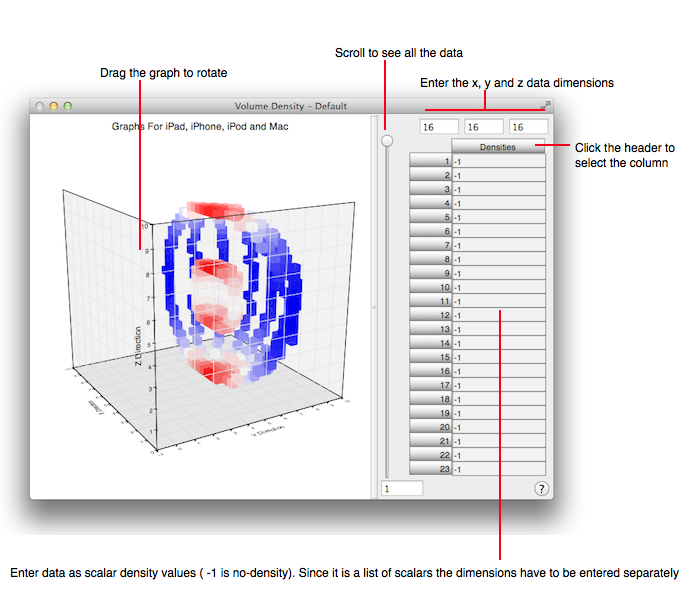
The figure below diagrams the Density task.
The 3D perspective graph is intended to give an overall qualitative indication of the data. The Z Splice point fill representation gives a more quantitative representation. Dragging the cursor over the 3D graph rotates it. While in Z Splice representation hovering the cursor over a density (in the x-y plane) shows its value and dragging the cursor scans each x-y plane successively.