Graph ► Tutorials ► Making A Map
This section explains how make a document from a user perspective. The type of document is called a "Map" because it can be loaded into other applications and its components can be queried upon. Making a map is described first and loading the map into an existing application is described next.
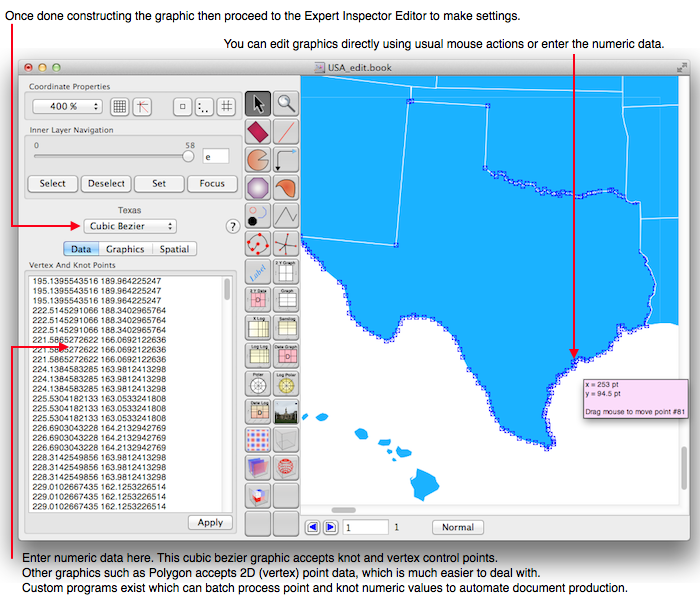
First make a map using point and click methods of Graph Builder as demonstrated in the following diagram. Graph Builder has its own extensive manual, consult that manual for additional information.
The diagram above shows how the map of the United States of America (USA) was constructed. That map, called USA, is available in the Graph application. It was made by point and click methods building up each state individually and then abutting the states to form the entire USA. Here is a hint: scan an image, drag out the Image graphic, load your scanned image into it, trace over that image with other graphics and then if desired delete the original scanned image from the document leaving only the live graphical components. Geographic maps are challenging whereas process maps, control consoles and flow charts can be very easy, being rectangles and circles connected by lines or simply connected by each other. The creation of your own map is a matter of ingenuity since there are many ways to make maps. If you need to bulk process node data into maps then please contact support@vvi.com so we can support your efforts. We have specialized tools to process point information into documents and hence maps.
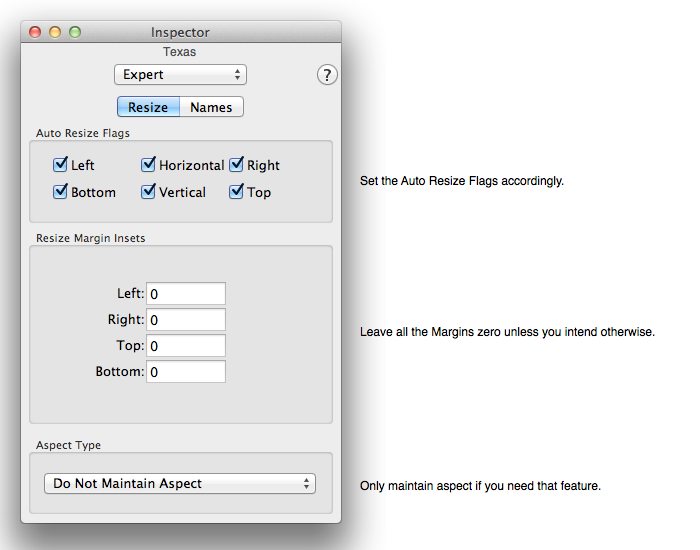
Once the map is constructed then select each element and assign the resize flags as shown in the following diagram.
and then assign the element name and description.
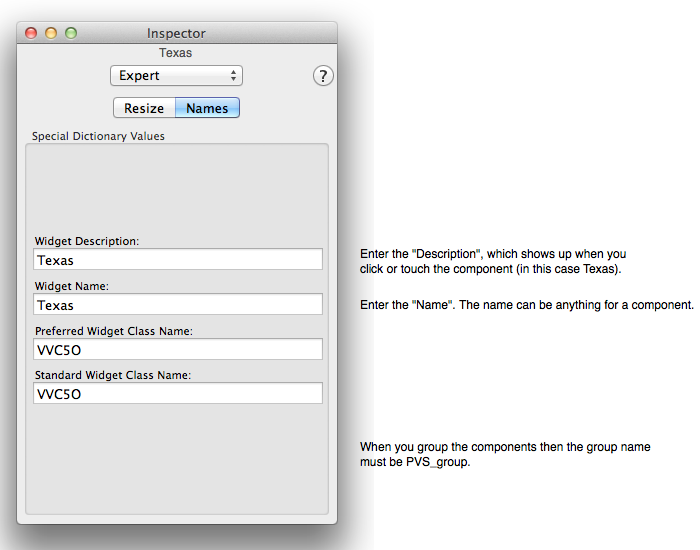
When all the attributes described above are set then select all the elements (in this case the states) and group them (using the menu item Format ► Group and choosing a normal group) and give the resulting group the name PVS_group (very important). You should probably set the group to autoresize in width and height and to maintain aspect.
To load your newly created document into the Graph application you will need to make it "Internet ready". That means you will have to take the normal Graph Builder document and export it as a skin document using the menu item File ► Export To... and choosing the Skin export type. It is that skin file, which is a compressed flat file that gets imported into the Graph application. Place that skin file on a web server or on your disk and import it into Graph this way: choose the Maps task, in the preference tool select a map entry other than USA for example the Map 1 element or an element that you have renamed, choose the Skin tool, enter the URL (file or http) of the skin file, click the Fetch Primary Skin button and then finally click the Done button. Your skin shows in the resulting view.
In summary, the steps to making a map are:
Making a simple map can take a few minutes, making a hard map can take days, batch processing thousands of maps from existing map data can take a few CPU hours. Once you have a map and wish to do more with it than simply query component names then consult the Document section to program your own application. For example, a process map can be used to click a process element, for example schematic element representing a valve, to then issue commands to that valve to turn it on and off. Another example: Click a state or other jurisdiction such as sales territory to then call the sales representative for that territory. The possibilities with maps are very interesting.