Graph ► Overview ► Popover (or Alert)
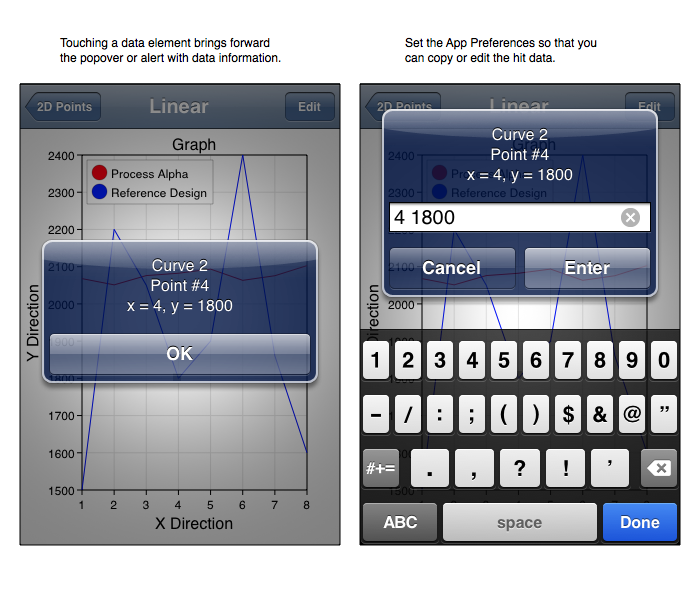
The popover (on the iPad) and alert panel (on the iPhone and iPod touch) is used to show the query of a task's graphical representation. For example, the figure below shows what happens when you touch a curve.
The popover shows the curve number (there can be up to 20 curves), the point sequence number and the point x and y values. Each task shows similar information in the popover related to that task's data. In the case of a map, the data is the map component's description as set in the Graph Builder map template (see Making A Map).