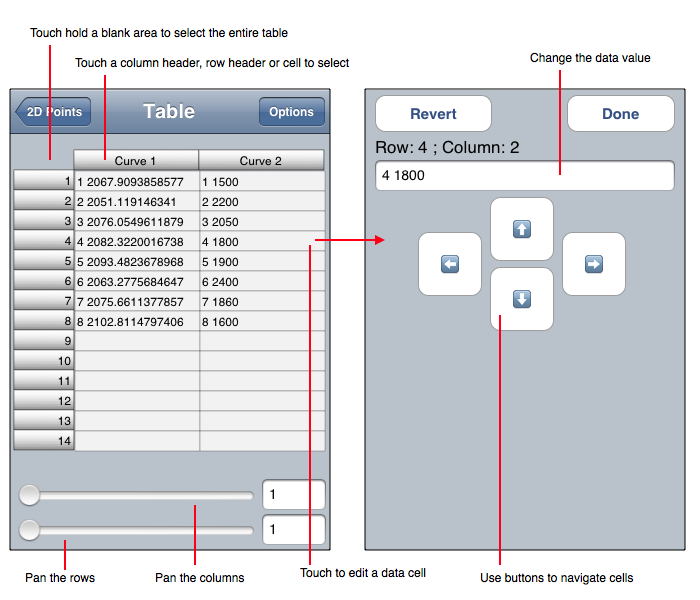
The table component of a Task is used to enter and display the decimal and character representation of data. The cells of the table can represent a label (text), scalar (a single decimal number) or point (2 or 3 dimensional point) entries. A typical table is diagrammed below.
The following is an itemization of table features.
Columns
A column of a table is the vertical collection of cells of the table. Touching on the column header (the grey portion at the top of each column) selects cells in that column. Touch-hold and then touching the Edit menu item edits the description for the column which is useful for setting labels for a legend. See Legend for additional information.
Cell Type
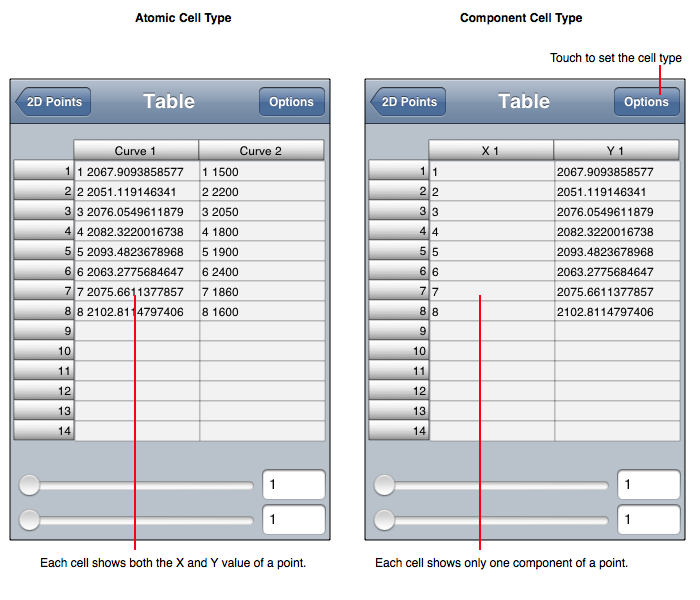
Each cell in a table is comprised of indivisible pieces of data. There are two types of "indivisible pieces of data" as defined here:
The type of cell used is specified in the table Options. By switching between types, dimensions can be resorted. For example, for 2D points the data is serialized in the format: x1 y1 ... xN yN. That is the atomic representation. By using the component representation the data is serialized in the format: x1 ... xN y1 ... yN. It is often the case that both serializations are useful and as a result, tables have two cell types.
The above discussion is in terms of 2D points but is equally applicable to 3D points in the obvious way. Notice that bar data is scalar and scalars only have one dimension so the atomic and component cell type are identical.
It is hard to overemphasize the fact that the atomic cell is the more consistent representation, but that the component cell is the more conventional representation. When you use the component cell type you will notice this fact. For example, deleting an interval of y-values will not remove the y-values but rather zero them. That is because those y-values are intrinsically (and implicitly) associated with the x-values. To remove the y-values you must also select the respective interval of x-values and then delete both of them simultaneously. Only then will the points be removed. By using the atomic cell, this is a non-issue because the x and y values are in the same cell and deleting a cell deletes both the x and y value pair of a point. This same issue applies to the many other operations applied to tables. By utilizing a sequence of operations that combine atomic and component representations the resulting composite operation can be fairly complex and useful. For example, in component element type paste in a column of x-values and then a column of y-values, switch to atomic element type and then copy the column of 2D points. In that way you have just transposed the matrix of data a.k.a.: changed serialization from x1 ... xN y1 ... yN to x1 y1 ... xN yN.
The figure below diagrams the difference between atomic and component cells for a 2D Points task.
Component Selection
Operations On Selection
Once a component is selected then touch-hold to bring up a menu of options. Choose one of the following from the menu:
It should be noted that if you select only one column or row of data then that column or row is extended with a subsequent paste. However, if you touch-drag an interval of columns or rows then the subsequent paste wraps over the rectangular cell selection.
Cell Edit
When you touch on a cell the cell editor is brought forward. Once forward the following applies.
If you paste to the entire table then the data needs to be formatted as follows.