Strip Chart ► Overview ► Major Components
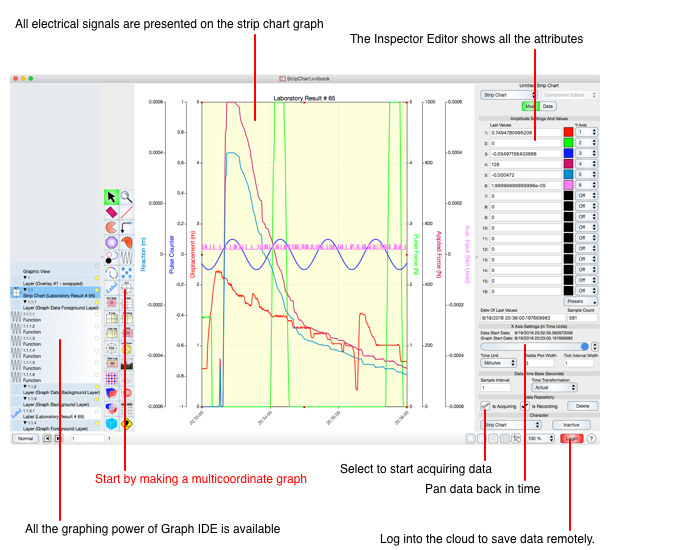
The following diagram shows a strip chart on a Graph IDE document. That strip chart shows up to sixteen separate signals acquired through various sources, namely Hardware. Signals are displayed as as curve of amplitude vs time and also a numeric value of the last value acquired. The strip chart also includes control groups that are diagrammed below.
Other controls appear in the various Inspector Editors and are described in the various corresponding sections.
Note that a strip chart is just another graphic on a Graph IDE document. As such, there can be multiple strip charts per document and any number of documents. Documents, along with corresponding channel data, can be saved locally or in the cloud. When a strip chart is copied to the pasteboard then its data is also copied and when it is subsequently pasted then its data and all its attributes are duplicated.
Note that Devices are from a common pool so only one device can be used for a unique strip chart at a time. If there are multiple devices on the computer then each strip chart can be associated with its own device and in that way data can be shown from multiple devices at a time.