Vvidget Code > Demonstrations > Mac OS X > Graph
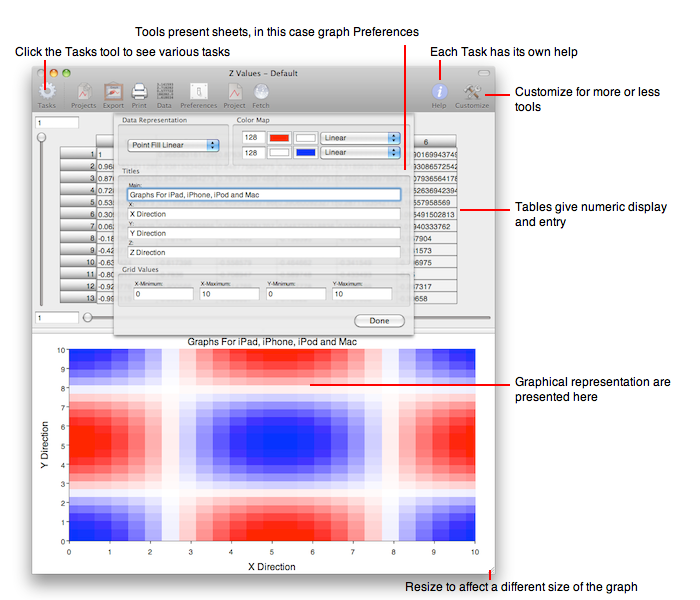
Graphs in the Graph application are made with Vvidget Code. Graph is setup so that a user enters data and then, by utilizing Vvidget Code, that data is translated to a graph. For example, a Z Values Chart Task is annotated below.
To demonstrate the Graph click this link: Graph.
| Please help improve this documentation. If a section is hard to understand, there is a typo, you would like a new section added, or you detect any other improvement that can be made then please email support@vvi.com with your information. |