DAQ Plot ► Preferences ► General ► Graph
Signal Graph
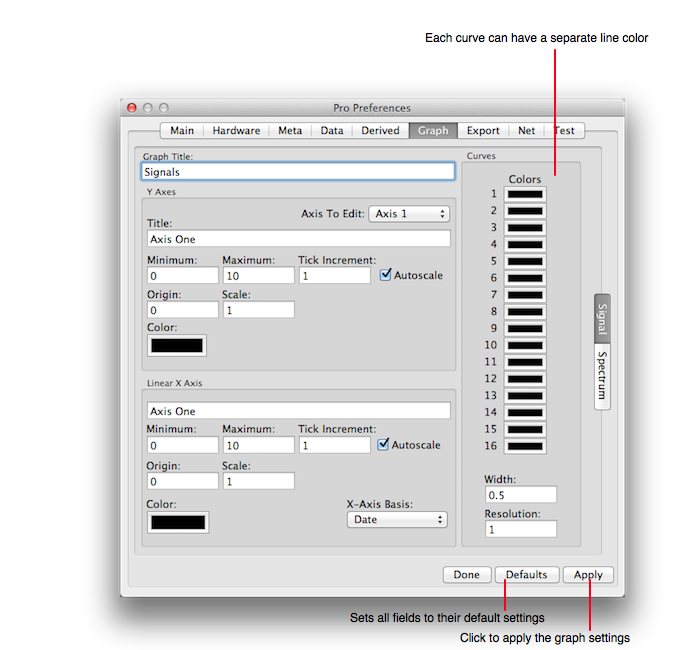
The following diagrams the Signal Graph preferences pane.
Graph Title: The graph title can be set using this field.
Each y-axis attributes can be adjusted per the input fields. First select the axis number to edit and then set the parameters for that axis.
Common Axis Attributes:
X-Axis Basis: Normally the x-axis is time and date. But, you can alter that by selecting a different x-axis basis. The basis is either Sample Index or another channel. For example, if it is Channel 1 then other channels (such as channel 2) have their normal y-value, but their x-value is that of channel 1's y-value. Such plots are called many things including trajectory plots, phase space plots, x-y plots, etc.
Linear X-Axis Attributes: When the X-Axis Basis is not Date then it is a normal linear axis and the attributes are similar to the y axis attributes.
Curve Attributes: The color, width and fidelity of each curve can be altered using the appropriate settings. Resolution is normalized to one pixel on a screen and should remain 1 while plotting. You may want to set it to 0 before exporting a graph for the maximum resolution, but after exporting set it back to 1. For screen display, any value less than one is overkill.
Spectrum Graph
The following diagrams the Spectrum Graph preferences pane.
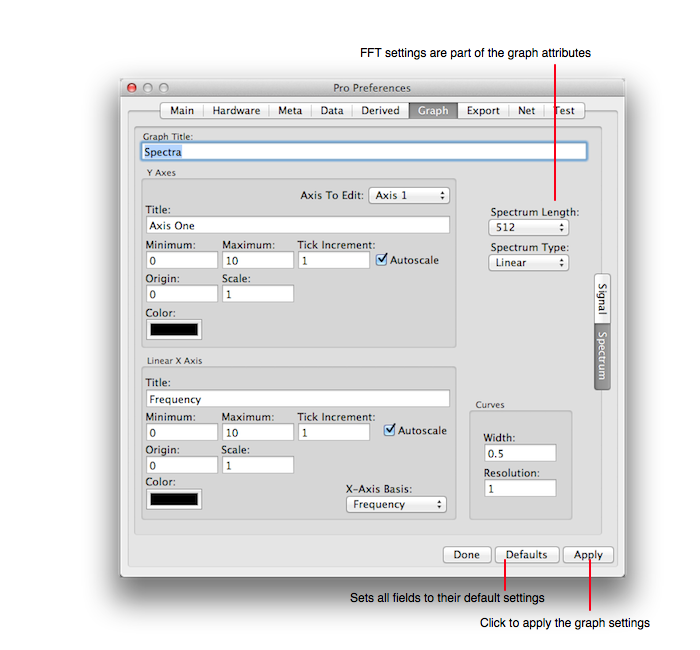
Common Axis Attributes: Most of the graph attributes are similar to the Signal Graph above, see that section for descriptions.
Spectrum Length: The Spectrum FFT length is considered a graphical attribute. Set it to the value that you want.
Spectrum Type: The Spectrum type can be either linear or power (log-mapped) and defines the y-direction value (mapping).