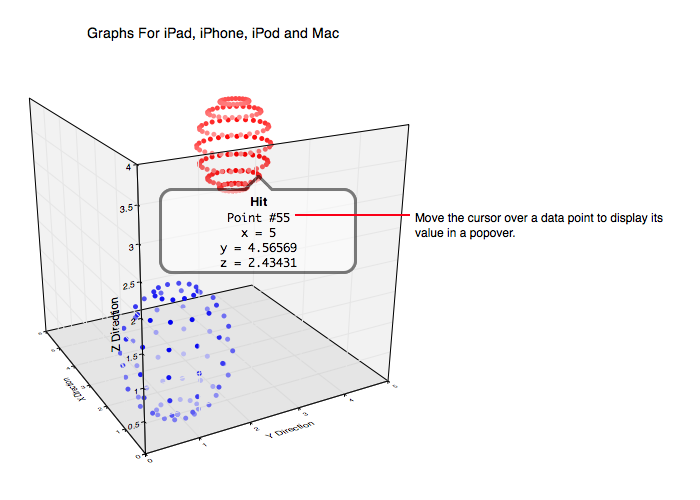
The Popover window is shown below.
The popover window appears when you hover the cursor over a data component which is one of a point, line or map component or some such thing. Each task's graphical representation can have distinct responses to the cursor but in general, the popover gives information regarding the data.
When a data component is clicked then it is selected and the popover becomes editable such as in the following diagram.
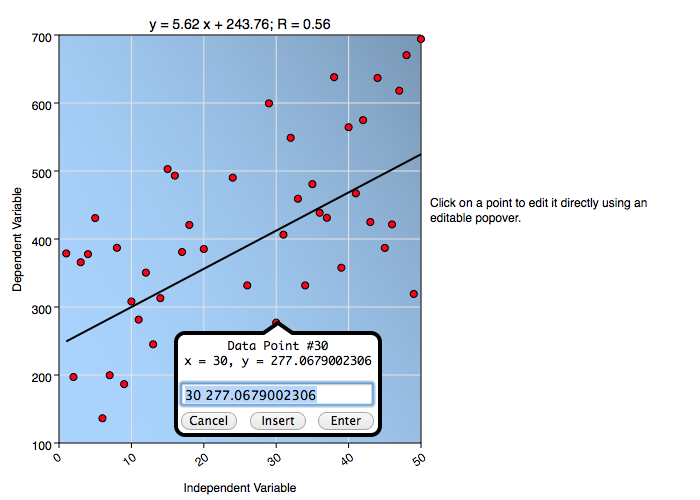
Change the resulting data atomic (a scalar, 2D Point, etc.) and then click Enter to alter the selected data. In this way, data can be empirically altered. For example, if you know a data point is obviously erroneous then you can either search for its numerical representation in the Table or click on it and then remove it by deleting all text in the editable popover and then click Enter (that removes the data). You can also simply reassign a data atomic to something that you think is more appropriate by altering the values in the popover and clicking Enter.