Table Of Contents
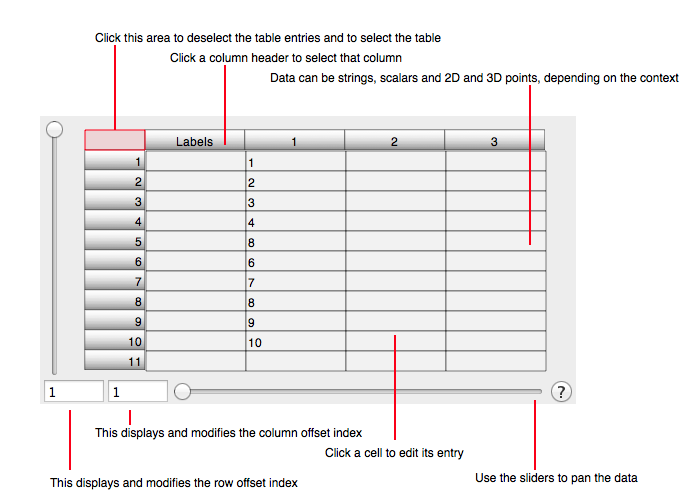
The table component of a Task is used to enter and display the decimal and character representation of data. The cells of the table can represent a label (text), scalar (a single decimal number) or point (2 or 3 dimensional point) entries. A typical table is diagrammed below.
The following is an itemization of table features.
Columns
A column of a table is the vertical collection of cells of the table. Clicking on the column header (the grey portion at the top of each column) selects cells in that column. Alt-click edits the description for the column which is useful for setting labels for a legend. See Legend for additional information.
Cell Type
Each cell in a table is comprised of indivisible pieces of data. There are two types of "indivisible pieces of data" as defined here:
- Atomic: For a bar graph the atomic element is a single number. For a line graph the atomic element is two numbers representing a x and y value at a 2D point. Thus, for a 2D point, each cell shows, and can can be used to edit, two numbers. The notion of an atomic cell is consistent with the idea that there is no way to specify a 2D point without specifying two numbers so the two numbers are considered indivisible (atomic) and must be located within one cell.
- Component: It is often the case that numbers come from other sources that do not represent a 2D point and those numbers need to be inserted into the table. Those numbers are often a sequence of scalars that represent only one dimension of a sequence of 2D points. As such, they incompletely specify an atomic element and are not usable by themselves. They need to be combined with another sequence of scalars to form a sequence of 2D points (and hence a curve). The component cell type is used to facilitate this need. In component mode, the table columns are arranged by interleaving dimension. Specifically, the x-dimension is specified in a column and then the y-dimension is specified in the adjacent column.
The type of cell used is specified in the Task Edit tool. By switching between types, dimensions can be resorted. For example, for 2D points the data is serialized in the format: x1 y1 ... xN yN. That is the atomic representation. By using the component representation the data is serialized in the format: x1 ... xN y1 ... yN. It is often the case that both serializations are useful and as a result, tables have two cell types.
The above discussion is in terms of 2D points but is equally applicable to 3D points in the obvious way. Notice that bar data is scalar and scalars only have one dimension so the atomic and component cell type are identical.
It is hard to overemphasize the fact that the atomic cell is the more consistent representation, but that the component cell is the more conventional representation. When you use the component cell type you will notice this fact. For example, deleting an interval of y-values will not remove the y-values but rather zero them. That is because those y-values are intrinsically (and implicitly) associated with the x-values. To remove the y-values you must also select the respective interval of x-values and then delete both of them simultaneously. Only then will the points be removed. By using the atomic cell, this is a non-issue because the x and y values are in the same cell and deleting a cell deletes both the x and y value pair of a point. This same issue applies to the many other operations applied to tables. By utilizing a sequence of operations that combine atomic and component representations the resulting composite operation can be fairly complex and useful. For example, in component element type paste in a column of x-values and then a column of y-values, switch to atomic element type and then copy the column of 2D points. In that way you have just transposed the matrix of data a.k.a.: changed serialization from x1 ... xN y1 ... yN to x1 y1 ... xN yN.
Component Selection
- Click on a column header to select a column. Shift-click twice to select an interval of columns. A single click on a column selects only that column for use and hence resulting operations are bounded to that column. A shift-click selects intervals of columns and hence resulting operations span columns.
- Click on a row header to select a row. Shift-click twice to select an interval of rows. A single click on a row selects only that row for use and hence resulting operations are bounded to that row. A shift-click selects intervals of rows and hence resulting operations span rows.
- Click to the left of the column headers, right above the row headers, to focus on the table. Clicking on that area deselects any cells of the table. Then select all cells in the table by typing command-a.
- Click-drag on the cells to select a group of cells and to scroll the table.
- Click-hold to select a single cell and also to bring up a menu of options. Click again to dismiss the options menu while keeping the cell selected.
Operations On Selection
Once a component is selected then choose one of the following:
- Delete (the delete key or del numeric keypad key) to delete the selected component.
- Copy (command-c, Copy main menu item, or click-hold menu) to copy the selected component.
- Paste (command-v, Paste main menu item, or click-hold menu) to paste the selected component.
- Cut (command-x, Cut main menu item, or click-hold menu) to cut the selected component.
- Click-hold on a selection to bring up the click-hold menu of options.
It should be noted that if you select only one column or row of data (with a click) then that column or row is extended with a subsequent paste. However, if you shift-click an interval of columns or rows then the subsequent paste wraps over the rectangular cell selection.
Cell Edit
When you click on a cell and then release, without dragging or holding, then the cell editor is brought forward. Once forward the following applies.
- Edit the cell text using the normal keyboard edit facilities.
- Click Return to enter the data, tab to enter and proceed to the next row in the column or shift-tab to enter and proceed to the previous row in the column.
- Use the arrow keys to enter the text and proceed to an adjacent cell in the direction of the arrow.
- Click the ESC or command-. to cancel cell editing and dismiss the cell editor.
- Use the on-board buttons to enter the data and dismiss, revert or proceed to adjacent cells.
Pop Over
- Move the cursor over a cell to see a popup. The table popup shows the cell indices and value. In the case of a blank cell it shows the cell data entry instruction.
Data Format
The data format for each import operation is define in the respective task section. Generally:
- For scalar data the column import (paste) format is a list of numbers, for point values it is a list of point components (for example, for 2D points: x1 y1 x2 y2 ... xN yN) where numbers are separated by a blank.
- When importing into numeric columns the format can be much more liberal. Any non-numeric ASCII delimiter can be used such as comma, semicolon, space, tab, Return, etc.
- When importing into a label row the delimiter is a Return character.
- When importing into a 2D point column or cell the format can be a x y numeric pair or a date number pair. The date is formatted as: MM/DD/YY HH:MM:SS.fraction and a numeric number representing the y-value follows. The date input is most appropriate for a date graph (see Set Of 2D Points).
- If you paste to the entire table then the table import sheet comes forward because pasted data is formatted without explicit delimiters and you need to supply additional information as follows.
- Choosing the double-return delimited format defines column ends as two consecutive return characters in the string serialization of the data.
- Under some circumstances, you can explicitly define the table dimensions and other data attributes.
- If the data dimensions is symmetric then you can transpose the data as needed. Non-symmetrical data can not transpose by inherent limitation.
To learn more about entering data see the The Enter Data tutorial section. Tables can be an intensive manual data entry operation. The Fetch section describes an automated data entry facility and the Programming section gives reference to the programming facilities.