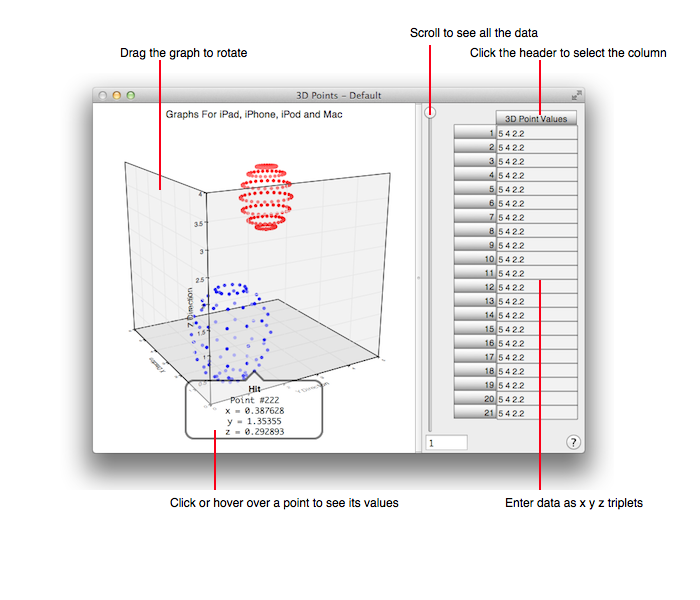
The 3D Points task makes 3D scatter plots of a sequence of triplet of numbers. By using the Preference tool it also makes 3D trajectory plots. The figure below annotates the 3D Points task user interface.
While importing data using Tables or Fetch keep in mind that the format is a list of triplets of numbers (3D points) separated by a blank such as x1 y1 z1 x2 y2 z2 ... xN yN zN.
Clicking or hovering the cursor over a point shows its value while dragging the cursor over the chart rotates it.