Least Squares takes 2D Points and plots them as a 2D scatter plot and also plots a linear regression of those 2D points.
The figure below annotates this task's user interface.
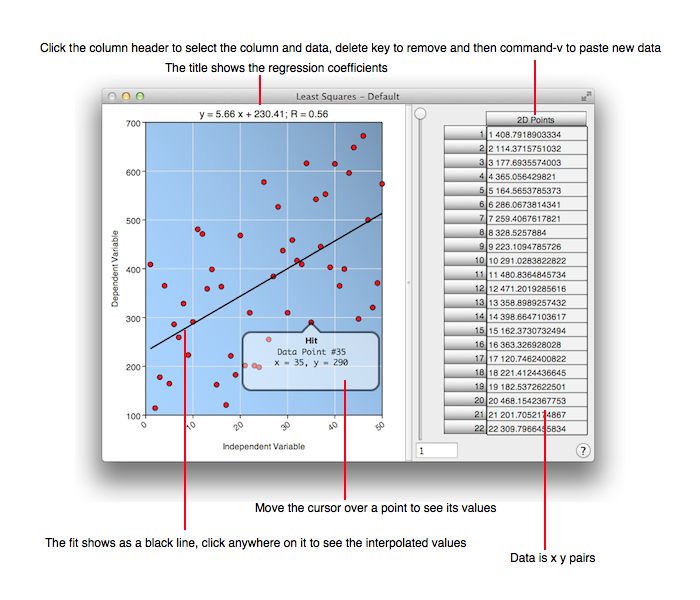
While importing data using Tables or Fetch keep in mind that the format is a list of pair of numbers (2D points) separated by a blank.
Hovering the cursor over a data point shows its values, hovering over the line segment shows the interpolated value of the regression. If you select the Labels representation in the Preference tool then you can see the sequence number of each data point on the chart.