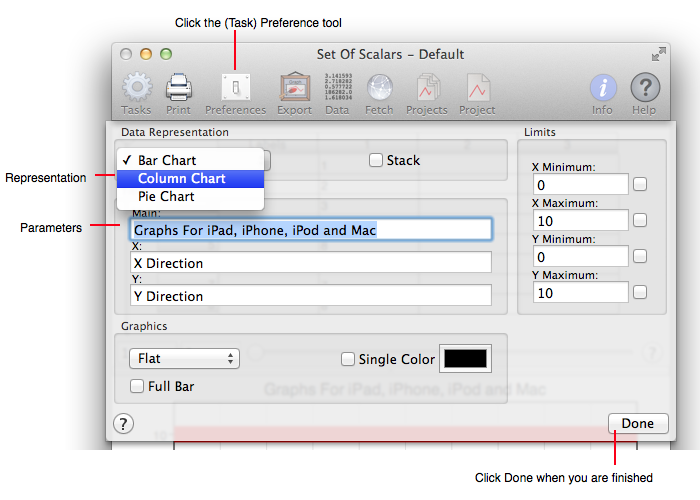
The following figure diagrams the Task Preferences tool. It is associated with the current task only and usually is used to affect changes to the task's graphical representation.
The Preferences settings are fairly self-explanatory and can vary according to the current task, but generally fall into these categories:
| Setting | Explanation |
| Data Representation | Sets the way the data is represented on the graph. |
| Titles | Sets the respective graph titles. |
| Graphics | Any effects are set in this area. |
| Legend | Sets the legend position. See Legend for details. |
| Trend | Sets the trend type. See Trends for details. |
| Limits | The graph's limits are on autoscale, however a limit may be explicitly set by entering the limit value and then turning on that option with the switch next to the limit value. |
The Preferences are purposely frugal since the intent is to focus on data representation, discovery and presentation and not necessarily graphical presentation. If you need more options (vastly more!) then consider the Export tool or the Skins tool.