Graph ► Tutorials ► Enter Data
There are two main ways to enter data which are explained in this section.
With the Tables interface you can select a row, a column or a cell and paste data. You can also select the entire table and paste in data. The data format is defined by the task type and is specified in the particular task section.
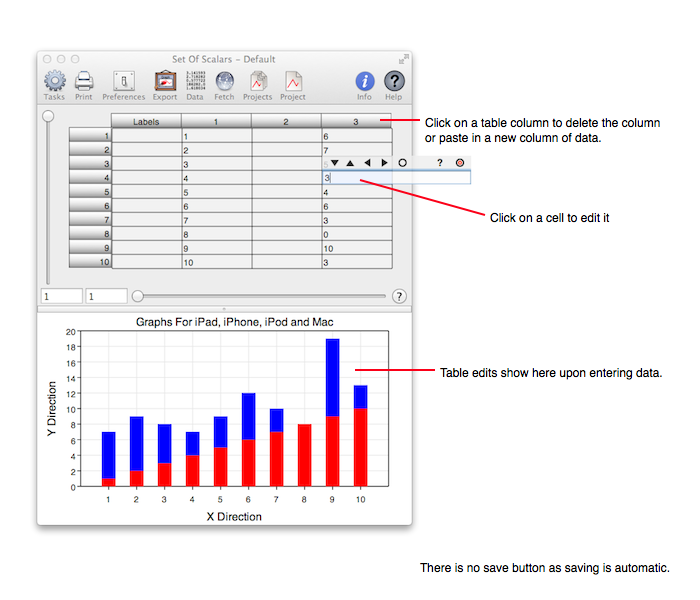
By way of example, the figure below shows a column chart table being edited. The cells are formatted as single numbers (scalars). The figure shows the cell editor when clicked on the fourth column (the third scalar column), fourth row. Clicking the Return key dismisses the editor and updates the graph. The data is automatically saved. There is so little to do that this tutorial is short and mostly a referral to other sections of this manual.
With the Fetch tool you can acquire data from a file or a web server (SOA facility). Fetching occurs one column at a time and the fetched URL contents are the same as pasted column data. In the case of a column chart, a list of numbers delimited by a space. Here are a few ideas when using Fetching:
The ultimate facility for entering data is your own program. For that see the Vvidget Code Reference Manual.