Graph ► Tutorials ► Import Data
This tutorial discusses how to import data into the Graph application. The essence of this section is as follows: Choose a Task that you want, enter some data into the task's Table, select the menu item Graph ► File ► Export... to export data and save the data to a file. Then Choose the menu item Graph ► File ► Import... and Open the file you just exported to. In the resulting Import sheet keep all settings at their defaults and click the Import button. You just learned how to make a file to import, i.e.: The export and import file formats are symmetrical so you can make files to import by first exporting representative data sets. Inspect the file contents and follow the general pattern for other data files to import. The rest of this section goes into various options and specifics regarding export and import features.
The description above provides steps to export and import data, but that is a fairly paltry, albeit to the point, explanation regarding the issue. The table below gives references and discussions regarding this matter.
| Reference | Discussion Of Import Feature |
| XML Fetch | The import feature in this tutorial simply shows how to import data but not other attributes of a task. In order to specify the importation of other parameters such as preferences (graph titles, etc.) a different and more flexible data format is requires. The XML format is a more flexible and industry standard format that helps with this issue. |
| Fetch | Importing a data file is important but is not the end all to this issue. The Fetch section describes how to automate importation of data either when the graph is presented or periodically in an animation. |
| Graph IDE | Graph IDE is a point-and-click tool that includes a greater ability to import data including importing via programmatic scripts and loadable bundles. |
| Vvidget Code | This Graph application was made with the Vvidget Code product which can be used to make similar graphing applications. Automating data importation is a very efficient way to import data. |
| Table | The table section goes into detail on how to copy and paste data to the entire table, or an individual component such as a particular row, column or cell. In regards to this section, lets reiterate one important operation as follows. To export the entire table's worth of data to the pasteboard first click on the table to the left of the column headers (in the empty area) and click command-a to select the entire table. Then command-c to copy the table's data. To import data from the pasteboard first select the entire table as before and command-v to paste in the data. The pasteboard data format is the same as that for exporting and importing data from a data file as described in this section. As such, you can copy an entire table to the pasteboard, paste that data into a text editor and save it for future data importation using Graph ► File ► Import... . |
| Custom Application | Many times a graphing program is used for post-production creation of some visuals from a larger process. That larger process may be associated with an engineering, business or financial task or may simply be the effort of a homework assignment. If that process is repeated then instead of importing data into Graph, as prescribed in this section, an alternative is to simply write your own graphing application and do away with manual importing of data. That is a pretty lofty and ambitious objective. Great effort has been applied to the Graph IDE product to reduce the effort required to make such a custom application and Graph IDE comes with documentation and projects to facilitate the making of such custom applications. It may be that Graph IDE has reduced the effort to make such custom applications to such a low level that doing so is now tractable (economically viable). Certainly for the inquisitive mind investigating such possibilities is, most likely, an interesting thing to do. |
Anatomy Of An Import File
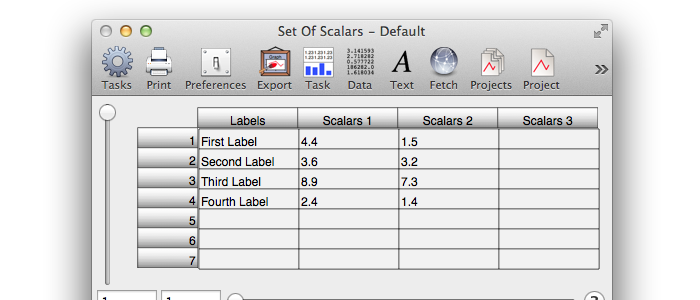
The contents of an import file can be easily determined by using the method described above, that is first export to save the data and inspect the result. This section gives the specifics for the Set Of Scalars task (a column chart). Remember that each Task has its own data format, but generally follows the description given below.
The data that is to be imported will result in the table entries and graph shown in the following figures.
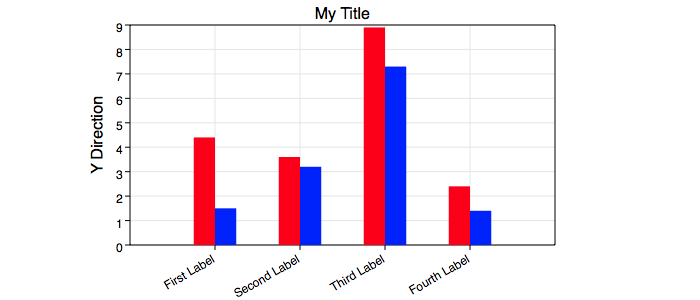
The data is represented by the x-axis labels and the bar heights. The content of the data file is as follows.
First Label
|
That is to say, each column of data is separated by two newline characters (a blank line) and each cell of the column is one line of text in the data file. Those conditions are conservative and it turns out that in actuality the first column, being labels, needs a new line delimiter for each cell entry but the next columns, being scalar values, only need some arbitrary delimiter character that is not a character found in a decimal representation. For example, the following contents will also import in to the Set Of Scalars task.
My Big Dog
|
The second example is probably very confusing because of the unusual delimiter characters so it is probably best to stick with one cell value per line and a blank line to separate columns of data.
Conclusion
There are many alternatives to import and export data and this tutorial explains one of the simplest procedures. This tutorial also gives many references to more advanced procedures and possible reasons to explore those procedures.