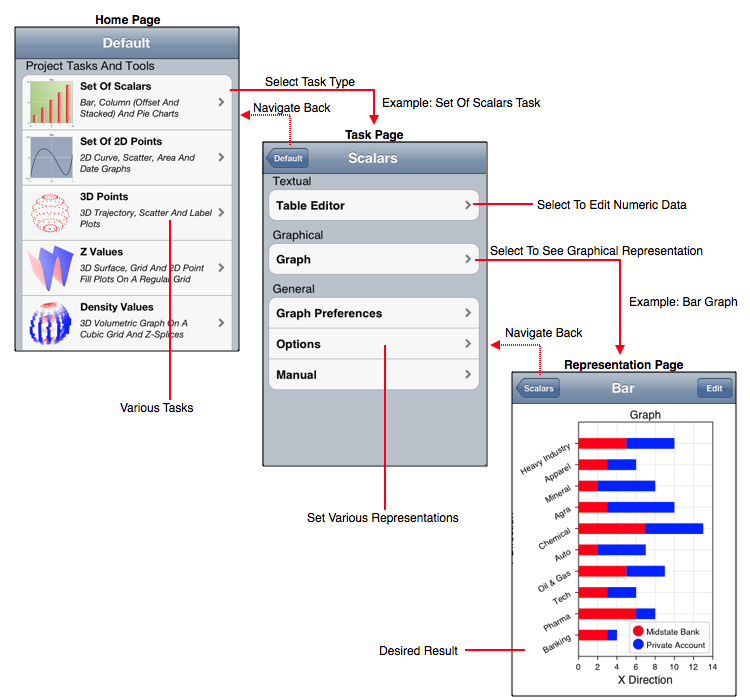
The figure below diagrams Graph's interface. It is a single window with access to various tasks and tools by navigating. The navigation pattern is Home > Task > Representation as shown in the figure below. Tools are described in the Tools section, graphs are described in the Tasks section and data input is described in various sections as referenced in the Enter Data section.
Probably the best starting point for learning how to use Graph is to actually use Graph. However, if you wish to read about using graph then perhaps a good starting point is the Table Editor section.