Graph IDE ► Basic Graphics ► Polygon
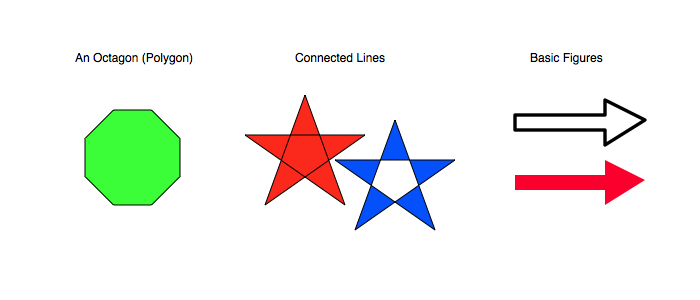
A polygon graphic is a sequence of points connected by line segments. When no line segments defined by the points intersect then the graphic is a polygon. If they intersect then the graphic is more general geometrically speaking. The figure below shows some examples of a polygon.
Some standard operations are itemized below.
Data Editor
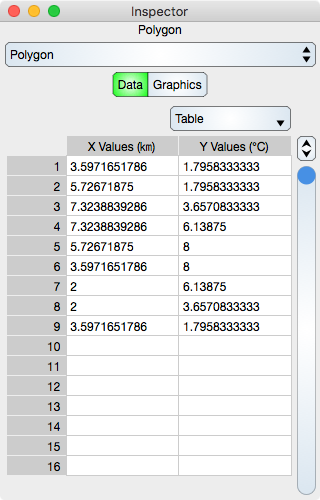
The Data Editor for the Polygon is shown below.
Table
Table controls are described in the Tables section.
The rows represent vertex values. While in Atomic mode, the cell represents a point (x and y value) and while in component mode the cell represents either a x or y value. Hence, in atomic mode there is one column while in component mode there are two columns.
Notice that the units of the first column are kilometers while the units in the second column are degree Celsius. That is because the polygon is on a graph (data layer) and takes on the units of the graph coordinate which is set to kilometer for the X-axis and Celsius for the Y-axis.
Graphics Editor
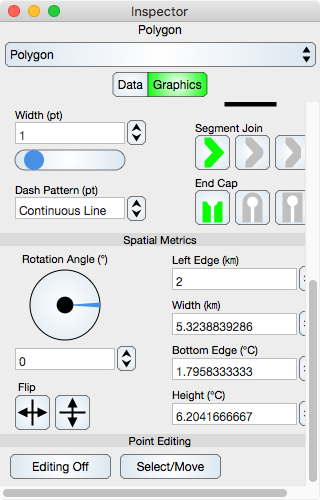
The Graphics Editor for the Polygon is shown below.
Common Controls
Controls common to all graphics are described in the Graphics section.
Point Editing
Editing Off/On : Places the graphic into or out of edit mode. While in edit mode the vertices are shown by indicators and can be adjusted using mouse or touch events. Double-clicking the graphic also toggles this edit mode.
Select/Move or Add/Delete : Select/Move mode permits the vertex editing to select and move the vertex location while Add/Delete mode will delete a vertex if it is hit or add a vertex if a polygon segment is hit. This can also be accomplished using the shift key if available.
Notice that while the units displayed in the reference frame values are those of the graph units as described in the Data Editor above. If the polygon where directly in a Graphic View (and not on a graph) then the units would be in report units of the Graphic View (not the units of the Graphic View coordinate which is always typographic points).