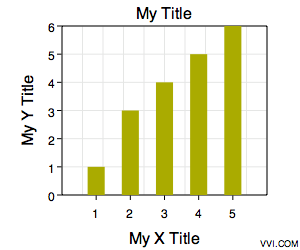
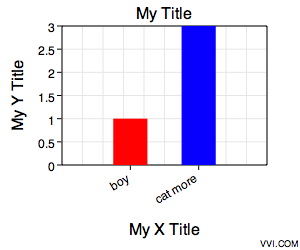
| Overloaded Fill Color | X-Labels And Different Colors |
 |  |
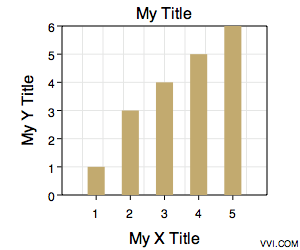
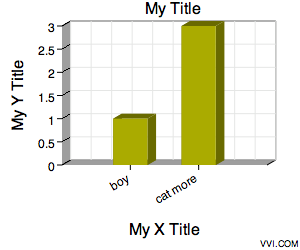
| Second Format Type | Extruded |
 |  |
Vvidget Code > Dictionary > Column Chart
This section explains how to form a dictionary for a column chart such as these:
| Overloaded Fill Color | X-Labels And Different Colors |
| |
| Second Format Type | Extruded |
| |
A column chart is a sequence rectangles (columns) whose height is determined by scalar data values. The x-axis numeric values are typically reassigned to text that identifies the column with a name identifier. Columns can be stacked or offset. By default, a column chart has x-ticks but those can be turned off on the associated template. The template can also be adjusted to give gradient columns and many other graphical attributes. A column chart is essentially a bar chart in the opposing dimension and often a column chart is referred to as a bar chart as the column representation of the data are themselves bars.
An example code fragment illustration follows:
/* Start of Illustration Code Fragment */
|
The code fragment above can be inserted into the illustration code section of the Illustration project for an immediate running Cocoa application. For additional information consult the Illustration section.
The following table defines the dictionary key and value pairs:
| Chart Specific Entries | |
| Key | Value Description |
| chart_type¹ | The chart type is the string column, indicating a column chart. |
| chart_subtype¹ | The chart subtype is always the string default. |
| chart_format_type¹ | One of the strings {default , alternate, extruded} which produces the varied results of the figures above. |
| title | The main title of the graph. If this key is not present then the template's title is used. |
| x_title | The x title of the graph. If this key is not present then the template's x-title is used. |
| y_title | The y title of the graph. If this key is not present then the template's y-title is used. |
| data_values | A white space delimited list of values representing the length of the column. See Data Oriented keys for additional information and keys. |
| label_I | A string for the I-th label value. I starts at 1. |
| bar_half_width | A number from 0.0 to 0.5 indicating the half width of the column. If 0 then the columns have no width and if 0.5 then the columns touch adjacent columns. The default is 0.25. |
| does_stack_bars | If 0 then columns are offset, if 1 then columns are stacked. This only makes sense for group columns when the data_I key is used. |
| fill_color | A hex encoded representation of a RGBA color value. This only is in effect for format type 1. If this key is not present then the color table template is used. |
| fill_color_I | A hex encoded representation of a RGBA color value for the I-th bar. I starts at 1 (example: fill_color_2=FF0000 assigns the 2nd bar to a red fill color). This entry overrides the fill_color and the table color specifications. |
| templates | A custom Templates directory. |
¹ Do not include this key value pair in the Interface Builder Plugin Inspector input string. It is included for you automatically.
If you incorporate this functionality into your own application then please consult Cocoa Programming. If you incorporate this functionality into CLI scripts then please consult Script Programming.
You can also modify the following Templates:
| Template Document Names | |
| Template | Description |
| PVST_Column_Chart | Forms the static attributes for this chart type when there are no label keys. |
| PVST_Custom_Label_Column_Chart | Forms the static attributes for this chart type when there is at least one label key. The bottom margin is greater to accommodate longer labels. |
| PVST_column_color_table | Forms the column color attributes for odd format type indices. |
| PVST_column_color_table_1 | Forms the column color attributes for even format type indices. |
Other examples
Group columns can be formed by using the data_I keys instead of the data_values key. Here is an example:
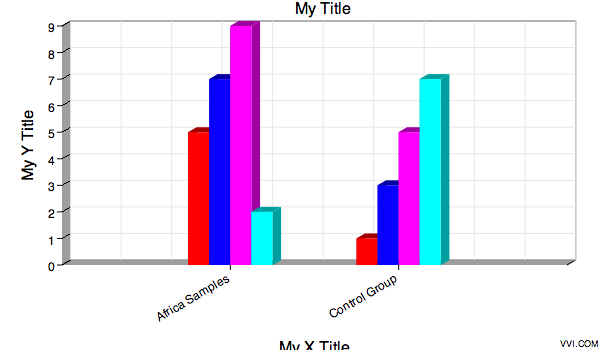
Notice how the X-Title is clipped. That is because the X-Labels are long. If you need a particular result then you need to modify the template. For example: You can turn off the X-Title or you can rotate the X-Labels less or you can do both. The specific solution is dependent upon the particular problem.
| Please help improve this documentation. If a section is hard to understand, there is a typo, you would like a new section added, or you detect any other improvement that can be made then please email support@vvi.com with your information. |