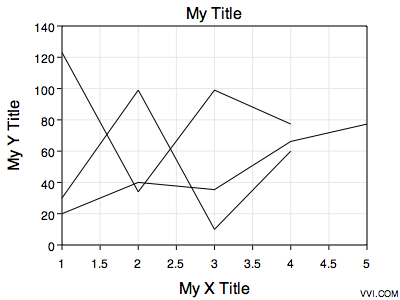
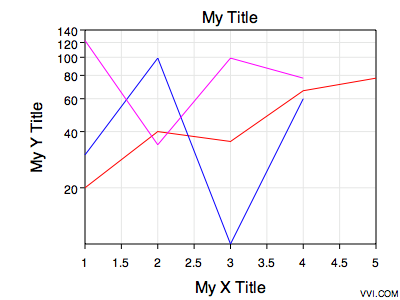
| Rectilinear, Single Color | Semilog Multiple Colors |
 |  |
Vvidget Code > Dictionary > Line Graph
This section explains how to form a dictionary for a line graph such as these:
| Rectilinear, Single Color | Semilog Multiple Colors |
| |
A line graph represents one or more sequences of x-ordered x y pairs (a point). Each sequence is plotted as connected line segments where the segments have end points of adjacent x y pairs in the sequence. Each point can also have a point tag which is a graphic, such as a dot, and label text. If the line segment display is turned off then the line graph looks like a x-ordered scatter graph.
An example code fragment illustration follows:
/* Start of Illustration Code Fragment */
|
The code fragment above can be inserted into the illustration code section of the Illustration project for an immediate running Cocoa application. For additional information consult the Illustration section.
The following table defines the dictionary key and value pairs:
| Chart Specific Entries | |
| Key | Value Description |
| chart_type¹ | The chart type is the string line, indicating a line graph. |
| chart_subtype¹ | One of the strings {linear , semilog, x-log y-linear, log-log, 2y-linear, polar, r-log} which specifies the graph coordinate type of {X-Linear, Y-Linear}, {X-Linear, Y-Log}, {X-Log, Y-Linear}, {X-Log, Y-Log}, {X-Linear, Y1-Linear, Y2-Linear}, {R-Linear, Theta-Degrees}, {R-Log, Theta-Degrees} respectively. |
| chart_format_type¹ | One of the strings {default, alternate}. |
| title | The main title of the graph. If this key is not present then the template's title is used. |
| x_title | The x title of the graph. If this key is not present then the template's x-title is used. |
| y_title | The y title of the graph. If this key is not present then the template's y-title is used. |
| data_I | A white space delimited list of values representing the x and y values of points in a sequence for curve index I where I starts at 1. See Data Oriented keys for additional information and keys. |
| label_I | A string for the I-th x-label value. I starts at 1. NOTE: If any label key is present then the data x-values are assumed unitless and an arbitrary unit must be assigned. The x-axis minimum starts at zero and runs to (N-1), where N is the maximum label index. To place a data point at each label x-value the data x-values should be the sequence {0, 1, 2, ..., (N-1)} but you may also choose to skip locations where a label is, etc. |
| line_color | A hex encoded representation of a RGBA color value for the line color. If this key is not present then the color table template is used. |
| templates | A custom Templates directory. |
¹ Do not include this key value pair in the Interface Builder Plugin Inspector input string. It is included for you automatically.
If you incorporate this functionality into your own application then please consult Cocoa Programming. If you incorporate this functionality into CLI scripts then please consult Script Programming.
You can also modify the following Templates:
| Template Document Names | |
| Template | Description |
| PVST_Line_Graph | Forms the static attributes for the X-Linear, Y-Linear graph. |
| PVST_X_Log_Line_Graph | Forms the static attributes for the X-Log, Y-Linear graph. |
| PVST_Y_Log_Line_Graph | Forms the static attributes for the X-Linear, Y-Log graph. |
| PVST_XY_Log_Line_Graph | Forms the static attributes for the X-Log, Y-Log graph. |
| PVST_2Y_Line_Graph | Forms the static attributes for a two y-axis graph. The y-axis can be of any type (linear, log, etc.) that can be made in a template. |
| PVST_Polar_Line_Graph | Forms the static attributes for a polar graph. |
| PVST_R_Log_Line_Graph | Forms the static attributes for a log-polar graph (r-log). |
| PVST_line_color_table | Forms the line colors for odd format type indices. |
| PVST_line_color_table_1 | Forms the line colors for even format type indices. |
The following are vvidget name components in the template that can be used to adjust graphical attributes of the respective parts.
| Vvidget Names | |
| Name | Description |
| PVS_graph | The graph. All graphical attributes of the graph can be altered. When queried upon the graph limits will autoscale. |
| PVS_graphic_prototype | The optional curve prototype (a Function graphic). All graphical attributes of the curve prototype can be altered and will be used to generate the curves for the graph. When queried upon the curve's data will be updated. This graphic prototype must reside on the graph's (foreground) data layer. |
| PVS_y1_graphic_prototype | If present, used for left-axis related graphics instead of PVS_graphic_prototype. This is only applicable to 2-y-axis graphs. |
| PVS_y2_graphic_prototype | If present, used for right-axis related graphics instead of PVS_graphic_prototype. This is only applicable to 2-y-axis graphs. |
| Please help improve this documentation. If a section is hard to understand, there is a typo, you would like a new section added, or you detect any other improvement that can be made then please email support@vvi.com with your information. |