| Rectilinear Perspective Scatter Chart |
 |
Vvidget Code > Dictionary > Perspective Scatter Chart
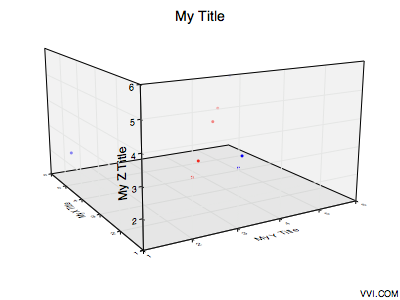
This section explains how to form a dictionary for a Perspective Scatter Chart such as this:
| Rectilinear Perspective Scatter Chart |
|
A perspective scatter chart is a sequence of x y z triplets (points) displayed with a point tag, which is either a graphic (marker) or label of some type. The default display is to show a little red dot at the point. The points are displayed on a 3D graph that is mapped via a perspective mapping to the page. The color of the dots can be mapped via a color mapping so they can represent another variable besides just location. The specifics are determined by the template configuration which is a Vvidget Builder document. The Vvidget Builder manual explains those issues in more detail.
For more data exploration and layout the graph can be exported to Vvidget Builder where it can be rotated in realtime. The default markers may be too small for your application and you can adjust them within the corresponding template.
An example code fragment illustration follows:
/* Start of Illustration Code Fragment */
|
The code fragment above can be inserted into the illustration code section of the Illustration project for an immediate running Cocoa application. For additional information consult the Illustration section.
The following table defines the dictionary key and value pairs:
| Chart Specific Entries | |
| Key | Value Description |
| chart_type¹ | The string perspective scatter, indicating a Perspective Scatter Chart. |
| chart_subtype¹ | The string linear. |
| chart_format_type¹ | The string default. |
| title | The main title of the graph. If this key is not present then the template's title is used. |
| x_title | The x title of the graph. If this key is not present then the template's x-title is used. |
| y_title | The y title of the graph. If this key is not present then the template's y-title is used. |
| z_title | The z title of the graph. If this key is not present then the template's z-title is used. |
| color_map_1_type | The color mapping type (0, 1, 2, 3). |
| color_map_1_length | Number of colors in map 1. |
| color_map_rgb_11 | Beginning color of the color mapping. |
| color_map_rgb_12 | Ending color of the color mapping. |
| color_map_2_type | The color mapping type (0, 1, 2, 3). |
| color_map_2_length | Number of colors in map 2. |
| color_map_rgb_21 | Beginning color of the color mapping. |
| color_map_rgb_22 | Ending color of the color mapping. |
| templates | A custom Templates directory. |
| data_values | A white space delimited list of values representing the x y z coordinates of each point. See Data Oriented keys for additional information and keys. |
¹ Do not include this key value pair in the Interface Builder Plugin Inspector input string. It is included for you automatically.
If you incorporate this functionality into your own application then please consult Cocoa Programming. If you incorporate this functionality into CLI scripts then please consult Script Programming.
You can also modify the following Templates:
| Template Document Names | |
| Template | Description |
| PVST_Perspective_Scatter_Chart | Forms the static attributes for the chart. |
| Please help improve this documentation. If a section is hard to understand, there is a typo, you would like a new section added, or you detect any other improvement that can be made then please email support@vvi.com with your information. |