| Rectilinear Perspective Surface Chart |
 |
Vvidget Code > Dictionary > Perspective Surface Chart
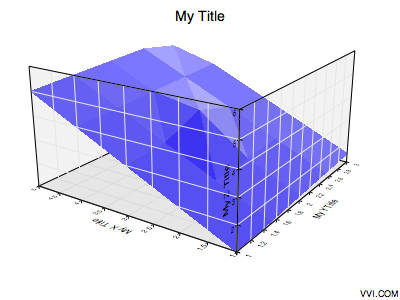
This section explains how to form a dictionary for a Perspective Surface Chart such as this:
| Rectilinear Perspective Surface Chart |
|
A perspective surface chart is a sequence of transformed scalars positioned on a regular x-y grid and given z-values that are the value of those scalars. Then those values are used to interpolate a surface over the regular grid. Finally, a color can be applied to the surface to represent a different dimension. The specifics are determined by the template configuration which is a Vvidget Builder document. The Vvidget Builder manual explains those issues in more detail.
For more data exploration and layout the graph can be exported to Vvidget Builder where it can be rotated in realtime.
An example code fragment illustration follows:
/* Start of Illustration Code Fragment */
|
The code fragment above can be inserted into the illustration code section of the Illustration project for an immediate running Cocoa application. For additional information consult the Illustration section.
The following table defines the dictionary key and value pairs:
| Chart Specific Entries | |
| Key | Value Description |
| chart_type¹ | The string perspective surface, indicating a Perspective Surface Chart. |
| chart_subtype¹ | The string linear. |
| chart_format_type¹ | The string default. |
| title | The main title of the graph. If this key is not present then the template's title is used. |
| x_title | The x title of the graph. If this key is not present then the template's x-title is used. |
| y_title | The y title of the graph. If this key is not present then the template's y-title is used. |
| z_title | The z title of the graph. If this key is not present then the template's z-title is used. |
| grid_x_length | The number of grid cells in the x-direction. |
| grid_x_minimum | The minimum x-value of the grid. |
| grid_x_maximum | The maximum x-value of the grid. |
| grid_y_length | The number of grid cells in the y-direction. |
| grid_y_minimum | The minimum y-value of the grid. |
| grid_y_maximum | The maximum y-value of the grid. |
| color_map_1_type | The color mapping type (0, 1, 2, 3). |
| color_map_1_length | Number of colors in map 1. |
| color_map_rgb_11 | Beginning color of the color mapping. |
| color_map_rgb_12 | Ending color of the color mapping. |
| color_map_2_type | The color mapping type (0, 1, 2, 3). |
| color_map_2_length | Number of colors in map 2. |
| color_map_rgb_21 | Beginning color of the color mapping. |
| color_map_rgb_22 | Ending color of the color mapping. |
| templates | A custom Templates directory. |
| data_values | A white space delimited list of values representing the z-values of the grid matrix. See Data Oriented keys for additional information and keys. |
¹ Do not include this key value pair in the Interface Builder Plugin Inspector input string. It is included for you automatically.
If you incorporate this functionality into your own application then please consult Cocoa Programming. If you incorporate this functionality into CLI scripts then please consult Script Programming.
You can also modify the following Templates:
| Template Document Names | |
| Template | Description |
| PVST_Perspective_Surface_Chart | Forms the static attributes for the chart. |
Grid Definition
The value for the key data_values is a list of numbers (a string representation) each number delimited by a blank which is mapped onto a regular grid in the normal way in an x-contiguous fashion. That is, lets say there are "n" z-values:
z1 z2 z3 ... zn
On a grid with definitions and relationships:
| nx | The number of z-values in the x-direction (the value of the key grid_x_length) |
| ny | The number of z-values in the y-direction (the value of the key grid_y_length) |
| n | Must equal nx ny |
| xmin | The value of the key grid_x_minimum |
| xmax | The value of the key grid_x_maximum |
| ymin | The value of the key grid_y_minimum |
| ymax | The value of the key grid_y_maximum |
| Δx | = (xmax - xmin)/(nx - 1) |
| Δy | = (ymax - ymin)/(ny - 1) |
| i | The index of the i-th element in the list of z-values (starting at 1) |
| j | The index of the j-th z-value in the x-direction (starting at 1) |
| k | The index of the k-th z-value in the y-direction (starting at 1) |
| i | = (k-1) ny + j |
then for the z-value zj,k (which is zi = z(k-1) ny + j) the x and y values are defined as:
xj = xmin + Δx (j - 1)
yk = ymin + Δy (k - 1)
to form the triplet (3D point): {xj, yk, zj,k}
which is to say that "successive z-values are ordered in a x-contiguous way on a regular grid in the x and y direction" and the units in the x and y direction are specified by separate parameters (xmin, xmax, ymin, ymax).
| Please help improve this documentation. If a section is hard to understand, there is a typo, you would like a new section added, or you detect any other improvement that can be made then please email support@vvi.com with your information. |