| Rectilinear Perspective Volume Chart |
 |
Vvidget Code > Dictionary > Perspective Volume Chart
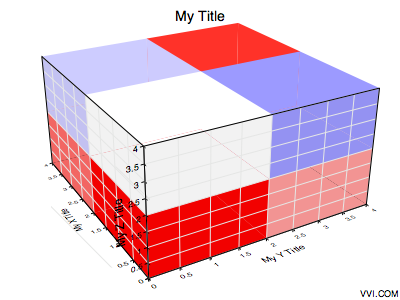
This section explains how to form a dictionary for a Perspective Volume Chart such as this:
| Rectilinear Perspective Volume Chart |
|
A perspective volume chart is a sequence of transformed scalars positioned on a regular 3D grid. Those scalars are mapped to a color using a color mapping. The specifics are determined by the template configuration which is a Vvidget Builder document. The Vvidget Builder manual explains those issues in more detail. If the color mapping coefficients are opaque then the volume appears solid. If it contains a transparent component then you can see into the volume and perhaps the volume will appear complex especially if the color map is setup correctly to make certain regions transparent and others opaque.
For more data exploration and layout the graph can be exported to Vvidget Builder where it can be rotated in realtime.
An example code fragment illustration follows:
/* Start of Illustration Code Fragment */
|
The code fragment above can be inserted into the illustration code section of the Illustration project for an immediate running Cocoa application. For additional information consult the Illustration section.
The following table defines the input string key and value pairs:
| Chart Specific Entries | |
| Key | Value Description |
| chart_type¹ | The string perspective volume, indicating a Perspective Volume Chart. |
| chart_subtype¹ | The string linear. |
| chart_format_type¹ | The string default. |
| title | The main title of the graph. If this key is not present then the template's title is used. |
| x_title | The x title of the graph. If this key is not present then the template's x-title is used. |
| y_title | The y title of the graph. If this key is not present then the template's y-title is used. |
| z_title | The z title of the graph. If this key is not present then the template's z-title is used. |
| grid_x_length | The number of grid cells in the x-direction. |
| grid_x_minimum | The minimum x-value of the grid. |
| grid_x_maximum | The maximum x-value of the grid. |
| grid_y_length | The number of grid cells in the y-direction. |
| grid_y_minimum | The minimum y-value of the grid. |
| grid_y_maximum | The maximum y-value of the grid. |
| grid_z_length | The number of grid cells in the z-direction. |
| grid_z_minimum | The minimum z-value of the grid. |
| grid_z_maximum | The maximum z-value of the grid. |
| color_map_1_type | The color mapping type (0, 1, 2, 3). |
| color_map_1_length | Number of colors in map 1. |
| color_map_rgb_11 | Beginning color of the color mapping. |
| color_map_rgb_12 | Ending color of the color mapping. |
| color_map_2_type | The color mapping type (0, 1, 2, 3). |
| color_map_2_length | Number of colors in map 2. |
| color_map_rgb_21 | Beginning color of the color mapping. |
| color_map_rgb_22 | Ending color of the color mapping. |
| templates | A custom Templates directory. |
| data_values | A white space delimited list of values representing the density-values of the grid matrix. A density value is a value between zero and one inclusive. See Data Oriented keys for additional information and keys. |
¹ Do not include this key value pair in the Interface Builder Plugin Inspector input string. It is included for you automatically.
If you incorporate this functionality into your own application then please consult Cocoa Programming. If you incorporate this functionality into CLI scripts then please consult Script Programming.
You can also modify the following Templates:
| Template Document Names | |
| Template | Description |
| PVST_Perspective_Volume_Chart | Forms the static attributes for the chart. |
| Please help improve this documentation. If a section is hard to understand, there is a typo, you would like a new section added, or you detect any other improvement that can be made then please email support@vvi.com with your information. |