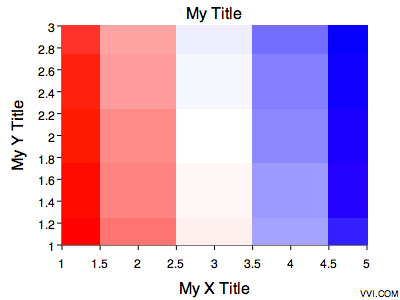
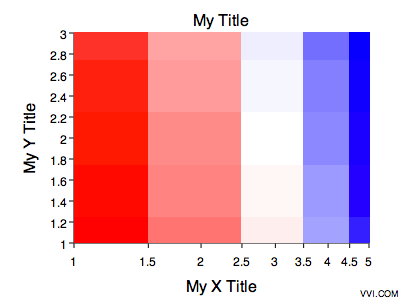
| Rectilinear Point Map | X-Log Point Map |
 |  |
Vvidget Code > Dictionary > Point Map Chart
This section explains how to form a dictionary for a Point Map Chart such as these:
| Rectilinear Point Map | X-Log Point Map |
| |
A point map is a sequence of values that are arranged on a regular 2D grid, mapped to different colors and then those colors used as a fill color for rectangles. When the grid is dense then the point map chart can appear to be an image. Selecting the appropriate color mapping is somewhat of an art form, but blue for cold (or low) and red for hot (or high) is an obvious choice. However, there are other color mappings that produce amazing representations and there are inappropriate color mappings that create mass confusion so that one need be careful when doing the mapping. The grid can reside on a nonlinear coordinate system and be represented by turning on the stroke value for the rectangular cells. Much of that is very domain specific and beyond the scope of this reference manual.
An example code fragment illustration follows:
/* Start of Illustration Code Fragment */
|
The code fragment above can be inserted into the illustration code section of the Illustration project for an immediate running Cocoa application. For additional information consult the Illustration section.
The following table defines the dictionary key and value pairs:
| Chart Specific Entries | |
| Key | Value Description |
| chart_type¹ | The string point map, indicating a Point Map Chart. |
| chart_subtype¹ | One of the strings {linear , semilog, x-log y-linear, log-log, polar, r-log} which specifies the graph coordinate type of {X-Linear, Y-Linear}, {X-Linear, Y-Log}, {X-Log, Y-Linear}, {X-Log, Y-Log}, {R-Linear, Theta-Degrees}, {R-Log, Theta-Degrees} respectively. |
| chart_format_type¹ | Always 0 (aliased to default). |
| title | The main title of the graph. If this key is not present then the template's title is used. |
| x_title | The x title of the graph. If this key is not present then the template's x-title is used. |
| y_title | The y title of the graph. If this key is not present then the template's y-title is used. |
| grid_x_length | The number of grid cells in the x-direction. |
| grid_x_minimum | The minimum x-value of the grid. |
| grid_x_maximum | The maximum x-value of the grid. |
| grid_y_length | The number of grid cells in the y-direction. |
| grid_y_minimum | The minimum y-value of the grid. |
| grid_y_maximum | The maximum y-value of the grid. |
| color_map_1_type | The color mapping type (0, 1, 2, 3). |
| color_map_1_length | Number of colors in map 1. |
| color_map_rgb_11 | Beginning color of the color mapping. |
| color_map_rgb_12 | Ending color of the color mapping. |
| color_map_2_type | The color mapping type (0, 1, 2, 3). |
| color_map_2_length | Number of colors in map 2. |
| color_map_rgb_21 | Beginning color of the color mapping. |
| color_map_rgb_22 | Ending color of the color mapping. |
| templates | A custom Templates directory. |
| data_values | A white space delimited list of values representing the z-values of the grid matrix. See Data Oriented keys for additional information and keys. |
¹ Do not include this key value pair in the Interface Builder Plugin Inspector input string. It is included for you automatically.
If you incorporate this functionality into your own application then please consult Cocoa Programming. If you incorporate this functionality into CLI scripts then please consult Script Programming.
You can also modify the following Templates:
| Template Document Names | |
| Template | Description |
| PVST_Point_Map_Chart | Forms the static attributes for the X-Linear, Y-Linear graph. |
| PVST_X_Log_Point_Map_Chart | Forms the static attributes for the X-Log, Y-Linear graph. |
| PVST_Y_Log_Point_Map_Chart | Forms the static attributes for the X-Linear, Y-Log graph. |
| PVST_XY_Log_Point_Map_Chart | Forms the static attributes for the X-Log, Y-Log graph. |
| PVST_Polar_Point_Map_Chart | Forms the static attributes for the polar graph. |
| PVST_R_Log_Point_Map_Chart | Forms the static attributes for the r-log graph. |
| Please help improve this documentation. If a section is hard to understand, there is a typo, you would like a new section added, or you detect any other improvement that can be made then please email support@vvi.com with your information. |