Vvidget Code > Programming > Cocoa > Tutorial
This tutorial shows how to make a Cocoa application that graphs your data. It also provides the fundamentals for incorporating many 2D and 3D graph types into your Cocoa applications by following the cookie-cutter programming style of the Illustration section. So, once you understand this tutorial you can simply copy and paste small sections of code to show many 2D and 3D graph types.
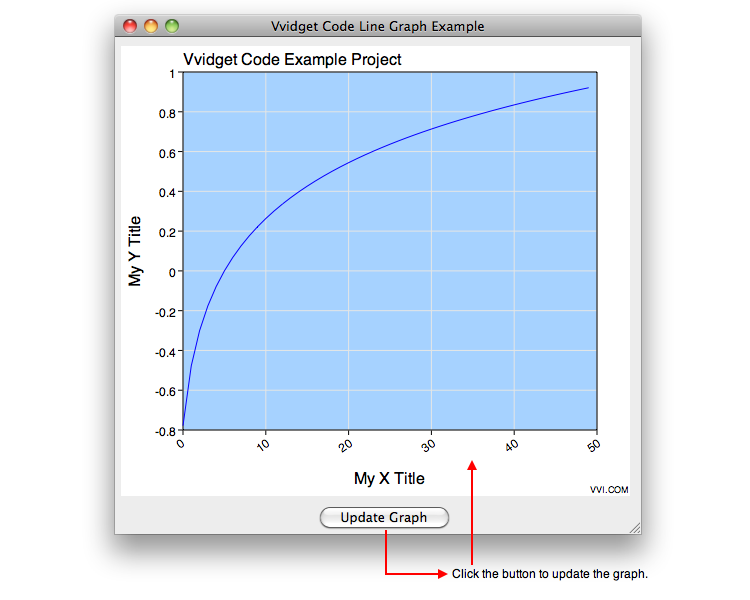
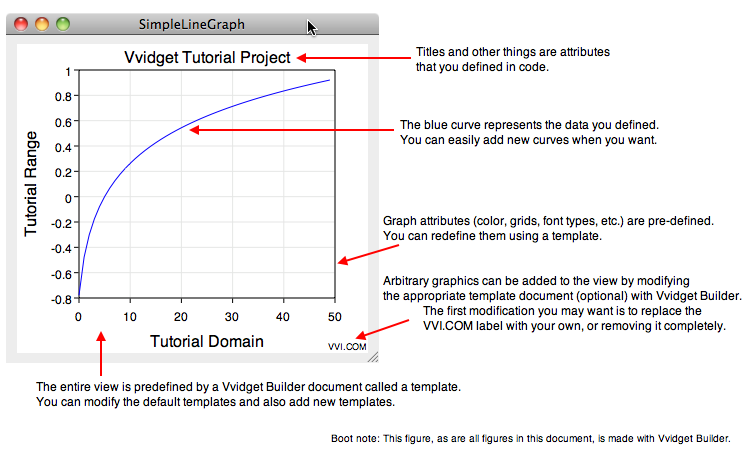
The result of this tutorial is a Cocoa application that looks like the following figure.
The basic steps for making such an application, which are elaborated on in later sections, are as follows:
| Step | Description |
| Prerequisites | You will have to install the Apple Xcode developer tools and the appropriate Vvidget packages. Both can be downloaded online if you do not already have them. After installing, you need to prime your development environment. |
| Make A New Project | Launch Xcode, located on your computer at /Developer/Applications/Xcode, and make a new Cocoa Application project. |
| Add Vvidget Capability | Xcode does not come with Vvidget capability so you will have to explicitly add it to your application. Adding that capability is a matter of properly referencing the Vvidget Frameworks (libraries). |
| Source Code Definitions | Add the source code as described below. The source code includes Vvidget API references, so you need to add the Vvidget capability first as was done in the previous step. |
| Interface | A Cocoa application's interface is constructed using the GUI tool called Interface Builder. Use that, as described below, to drag and drop a graph and make connections to the source code. |
| Source Code Implementation | Now that the definitions and interface are constructed the actual implementation can be added. That amounts to adding a handful of code in a cookie-cutter fashion. |
| Testing | Click the Build And Run button within Xcode to test the application. |
| Refining | Once your Xcode project is graphing while running its target (application) then you can modify the source code to acquire and present your actual data using the graph types, data values and format you choose. Reference are provided at the end of this tutorial for that purpose. |
| Deploy | Using the Finder, locate your application in the build directory of your project, click on the application (the bundle with extension "app") and then click File > Compress. The result is a zip file that can be sent to others. |
The following describes the steps above in greater detail. The project explained here is available at a link given below. You can download that project and build and run using Xcode without reading this tutorial or you can read the following sections to understand how the project was made and then download it.
Prerequisites
Download and install Xcode. If you have not done this before then click: http://developer.apple.com/devcenter/mac to get started or insert the Mac OS X install disk into your computer, locate the Xcode package and install. If you are updating Xcode then I suggest that you uninstall it first (see its notes), reboot, install the new version and then reboot.
If you have not already done so, go to http://www.vvidget.org/download and download and install the VvidgetCode distribution. For completeness sake, you should logout and then login to your home account. That is because there are some Vvidget components used in development that are based on services, whereas an end user application such as Vvidget Builder or an application you write does not have that issue. In any event a logout and in or a reboot is a nicety of the development environment and may not be needed.
After installing Vvidget lets first prime Interface Builder so there isn't a gotcha later on. Priming means load the Interface Builder Vvidget Code Plugin. To do that launch Interface Builder, close the "Choose A Template" panel, click the Preferences ... menu item, click the Plug-ins icon, click the add button (plus sign), Navigate to /Library/Frameworks/VvidgetCodeKit.framework and then click Open. The Vvidget Code Kit Pre-made Graph Icon will be at the bottom of the list in the Interface Builder Library panel. We will come back to Interface Builder later but for now just quit it.
Even though that was long winded, the prerequisites have been "just the usual stuff" for prepping a development environment and is not really particular to Vvidget.
Make A New Project
Launch Xcode, located on your computer at /Developer/Applications/Xcode, and in its main menu click File > New Project .... and then from the New Project panel select the Mac OS X Application > Cocoa Application template as shown below.
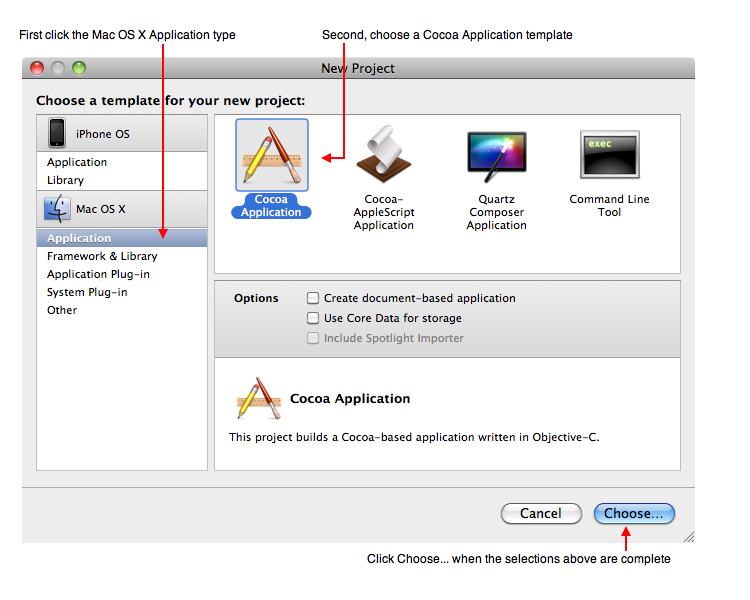
Then click the Choose ... button and give the project a name, such as "SimpleLineGraph" and then click Save. The result will be an Xcode project document much like the figures below. The next sections deal with the files SimpleLineGraphAppDelegate.h which is a source code definition file, SimpleLineGraphAppDelegate.m which is the file that implements the computer code specific to your needs, and MainMenu.xib which is a user interface template document that will be altered using the application Interface Builder for specific features of the application at hand. Remember that MainMenu.xib defines the geometry and graphical effects of the interface while SimpleLineGraphAppDelegate.m implements the functions that are executed by the Cocoa application.
Add Vvidget Capability
Xcode does not come with Vvidget capability so you will have to explicitly add it to your application. Adding the capability is a matter of properly referencing the Vvidget Frameworks (libraries). After adding those frameworks your application will be self contained and can be distributed by zipping it up and mailing it, placing it on an Internet site or some such thing (it is up to you).
What follows is fairly standard, but you may or may not have encountered it before and you may have a different way to do it that is equally valid. In addition, there are several other ways to program with Vvidget that are not described in this tutorial, but the way below is definitely a solid mainstream approach.
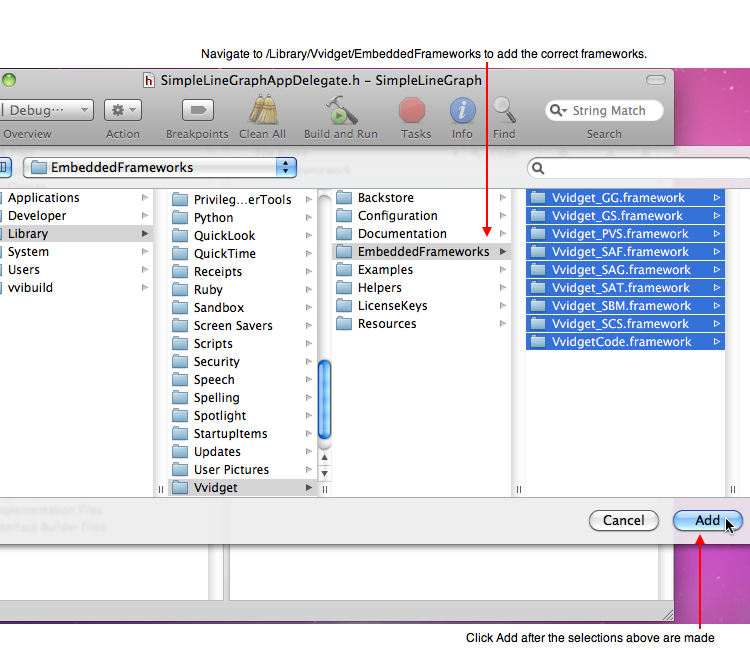
In Xcode, open the Frameworks Group on the left hand side of your project document and select the Linked Frameworks folder. That folder is shown in the second figure below. Then click the menu item: Project > Add to Project ... and in the resulting panel navigate to /Library/Vvidget/EmbeddedFrameworks. Then select all of the frameworks presented and click Add, as in the figure below. A panel will give some options, just click the Add button again as the default settings are sufficient.
The operations above added Vvidget references to your project so now you can refer to Vvidget, but it did not add Vvidget to your application. The next section will encapsulate Vvidget within your application so that your application will be self contained and can be distributed to other computers without any concern as to whether Vvidget is on those computers or not and also no concern regarding other versions of Vvidget on the same computer.
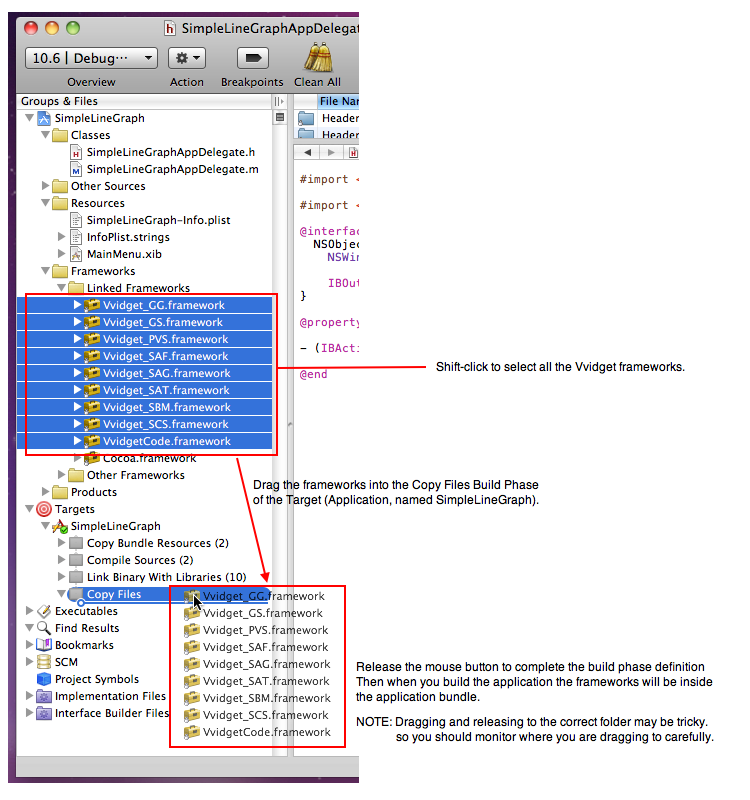
To encapsulate Vvidget within your application you will add a Copy Phase to the building of your application. That way, the Vvidget Frameworks that you referenced above will be copied into your application when you build it. For that purpose, open the Group folder named Targets and then open the SimpleLineGraph group. You will add a Copy Files group as shown below. In the Xcode main menu click Project > New Build Phase > New Copy Files Build Phase. In the resulting panel select the Frameworks destination from the pop up button. Then close the panel. Finally select all the Vvidget Frameworks in the Linked Frameworks folder and drag them into the Copy Files group you just made as shown in the figure below.
That is all the preparatory work you need do. The rest of the work deals with the details of your particular problem. That is: Defining what you want to do, constructing the appropriate user interface and implementing algorithms and data construction so that you can show a graph that you want.
Source Code Definitions
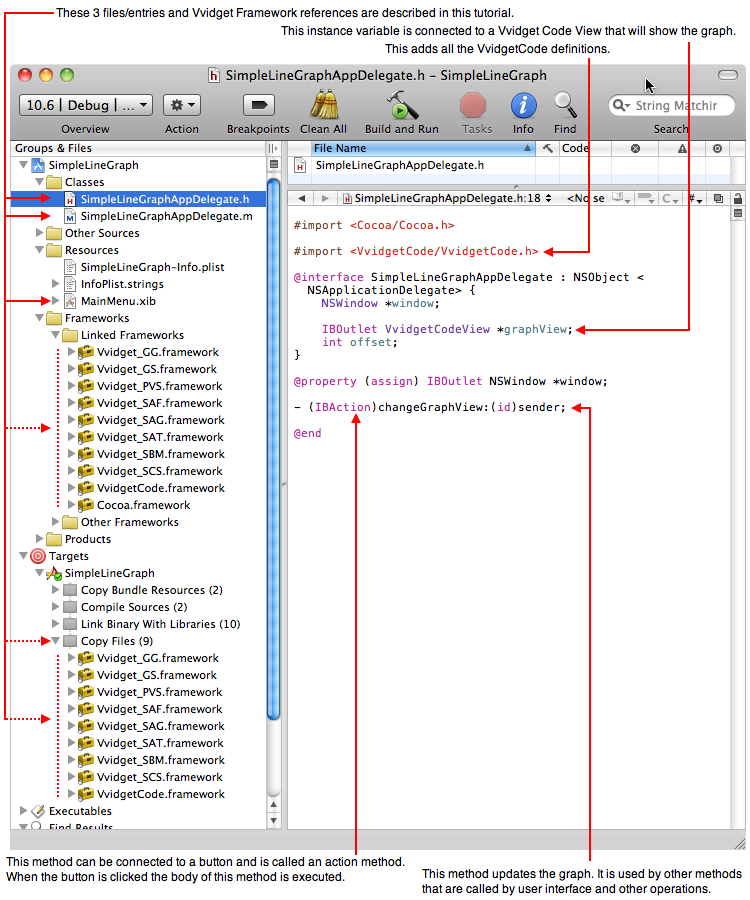
This step adds the definitions of your particular application. It is important to add definitions first because those references will be used in the next section to wire up the user interface, which in this case is simply the view with a graph in it. The header file, SimpleLineGraphAppDelegate.h, is where the definitions will be placed. Click the SimpleLineGraphAppDelegate.h entry within the Xcode document to the left of the project window as shown below and then enter the information as shown on the right portion of the figure below. The critical part is the instance variable named graphView which will be assigned a value within Interface Builder. The code associated with the changeGraphView: method will perform the actual graph generation routine.
[Erratum: In the figure below, VvidgetCodeView should be VvidgetCodeClientView.]
Interface
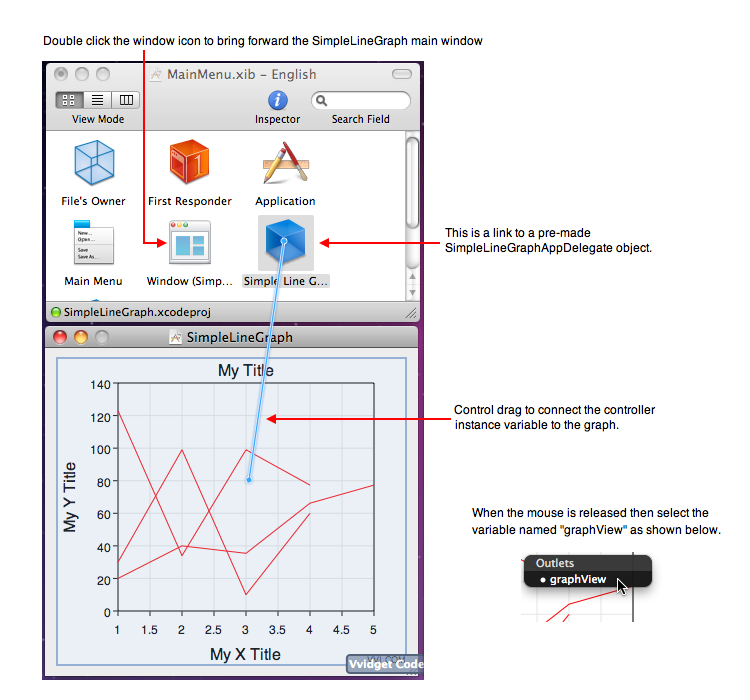
Double click the MainMenu.xib file entry in the Xcode project document. That launches Interface Builder with a template of the interface for your application. Double click the Window icon, as shown below, to bring up the empty window that is the primary window for your application. If the Interface Builder Library is not visible then click Tools > Library. Scroll to the bottom of the Library icons and select the Vvidget Code icon entry. Then drag that Icon from the Library window to your application's Window. That instantiates (makes) an actual Vvidget Code View with a default line graph and places it into your application's user interface (view hierarchy). That View instance needs to be assigned (connected) to the graphView instance variable referenced above. Once assigned, the application is functional and a graph will be made according to your prescription. To make that assignment (called a connection) control-drag the cursor from the Simple Line Graph App Delegate icon to the Vvidget Code View frame as shown in the figure below and then click the graphView entry in the resulting panel. Then save the document by clicking command-s.
Although you are done with making the interface you may choose to stay within Interface Builder and play around with the Vvidget View. For that purpose, click on the graph and click Command-1. That brings forward the Vvidget Inspector Editor. From there you can make two and three dimensional graphs and export them to Vvidget Builder for markup. But in order to gain full functionality of the inspector you will first need to understand the dictionaries associated with the graphs and a few other things. That is a digression from this tutorial, so if you do play around with the graph a bit then come back and read the following sections to complete your graphing application.
Source Code Implementation
Next, click the SimpleLineGraphAppDelegate.m entry and then enter the implementation information as shown in the figure below. It is pretty obvious what the code is going to do. It will build a data string, add some entries to a dictionary and then make the graph and display it. When you modify the project for your own needs you should serialize your data into dataString and choose the appropriate dictionary entries for the graph type and associated attributes, further reference for that is provided below. Before getting into references for those details lets complete the app and get it running.
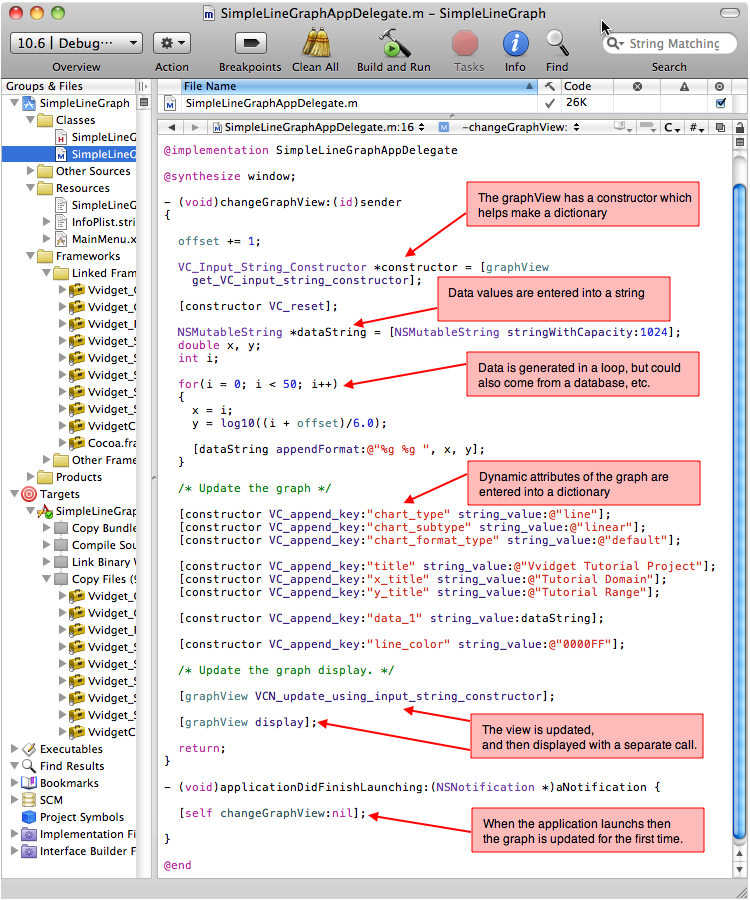
What follows is an explanation of each code fragment shown above. The following fragment places the curve data into a string.
NSMutableString *dataString = [NSMutableString stringWithCapacity:1024];
|
The next fragment builds a dictionary of entries which define the attributes of the graph. Among other attributes, the data as constructed above is inserted into the dictionary as an attribute (a key and value pair).
VC_Input_String_Constructor *constructor = [graphView get_VC_input_string_constructor];
|
Once the dictionary is made the remaining code updates the internals of the graph view and then displays the graph. The code fragment below shows the lines of code for that purpose. Note that updating the view is separate from displaying it. That is because, as you might find out with more advanced use, a graph view does not necessarily have to be displayed, rather its encodings can be used for other purposes.
[graphView VCN_update_using_input_string_constructor];
|
Testing
Click the Xcode project window and then click the Build and Run button. Your application will look like the following.
You can quickly extend the application by dragging a button from the Interface Builder Library onto your interface and control-drag from that button to the following action method that you need to insert into the header and source files.
- (IBAction) export:(id)sender
|
After doing that then your application can export your graph, including the data on it, into Vvidget Builder for markup and publication quality results. Vvidget Builder has a plethora of user interface controls and comes with its own User Manual. See that manual for further details.
The figure at the top of this tutorial showed a button which updates the graph. You can drag a button to your application's window and connect that button up to the changeGraphView: action method by control dragging from the button to the SimpleLineGraphAppDelegate (the reverse of the control-drag shown above). Also, the figure shows a graph with a blue background and rotated x-labels. Those attributes come from a template document that you can make with Vvidget Builder. Vvidget Builder comes with an extensive manual and the Vvidget Code reference manual describes in length how to use templates. That feature is left for further reading in other sections of the Vvidget Code Reference Manual.
Refining
By installing the Vvidget packages and adding a few lines of code you are able to make a line graphing application that you can then distribute to your own customers. Of course there are still many unanswered questions, lots of detail and a plethora of options. In addition, developing a major application can take a few months to many years of work and it is not the intent of this tutorial to describe all of the issues involved in that. Instead of describing those in detail let me just make reference to those issues with links for further investigation.
| • | You can download the project described above by clicking this link: SimpleLineGraph.zip which is also available as a Vvidget Code Example project on your disk at: /Library/Vvidget/Examples/VvidgetCode/SimpleLineGraph and placed there when you installed Vvidget Code. |
| • | The project described above is closely related to the Chart Tasks and some other tools that are available within Vvidget Builder. When you downloaded Vvidget, you also downloaded that application so you can try out Vvidget Code functionality right away through an application without any additional work. |
| • | This tutorial uses the Embedded Vvidget Frameworks to make a self-contained application to distribute. However, there are also other ways to use Vvidget. Those capabilities are beyond the scope of this tutorial and are explained elsewhere in the Vvidget Code Reference Manual. |
| • | In a larger project the Interface Builder document is factored into multiple documents, there are many controllers connected to the interface elements, resources are loaded on demand and the topology of the classes is much more complex and intertwined. Refining such as that is beyond the scope of this Tutorial. |
| • | If you are going to release your application into the wild then you need to play fair with other developers. You can do that by selecting the SimpleLineGraph-Info.plist entry in the Resources Group and changing the Bundle Identifier to the correct URI. Typically you change the "yourcompany" part to the name of your company. However you change it make sure it has a very high or assured probability of being unique. Without uniqueness, applications can be mixed up. If you are at a university then you may try something like: "edu.universityname.departmentname.yourname.productname". |
| • | This tutorial shows only a line graph and just a few ideas. Vvidget Code makes several graph types from pie charts to perspective charts. Further detail is provided throughout the Vvidget Code Reference Manual. |
Deploy
Once your application is graphing properly then you will probably want to send it to others. The easiest way to distribute an application made by the steps of this tutorial is to use the Finder, locate your application in the build directory of your project, click on the application (the bundle with extension "app") and then click File > Compress. The result is a zip file that can be sent to others. Some other options are to make a disk image file (dmg) or an Installer package. A disk image file is nice because it contains checks to make sure the file was download correctly. An Installer is nice because it not only contains checks, but can also contain a certificate reference to be used for signing the package. In addition, such methods also provide for preamble information such as a Welcome, Read Me, license and other options that may be specific to your needs. What ever your needs, there are many options and a detailed discussion is beyond the scope of this tutorial. In any event, compressing your application and emailing it or placing it on a download point on the Internet is probably the desirable way to distribute your application. For additional information consult the Deploy section.
Conclusion
By following the few steps above even a beginner can make a basic graphing application. With a bit of other knowledge and effort that application can evolve into a robust desktop application showing a plethora of graph types from simple line graphs and log graphs to more advanced 3D perspective graphs. The application shown in this tutorial is but a fraction of the capability of Vvidget.
| Please help improve this documentation. If a section is hard to understand, there is a typo, you would like a new section added, or you detect any other improvement that can be made then please email support@vvi.com with your information. |