Vvidget Code > Programming > Script > Tutorial
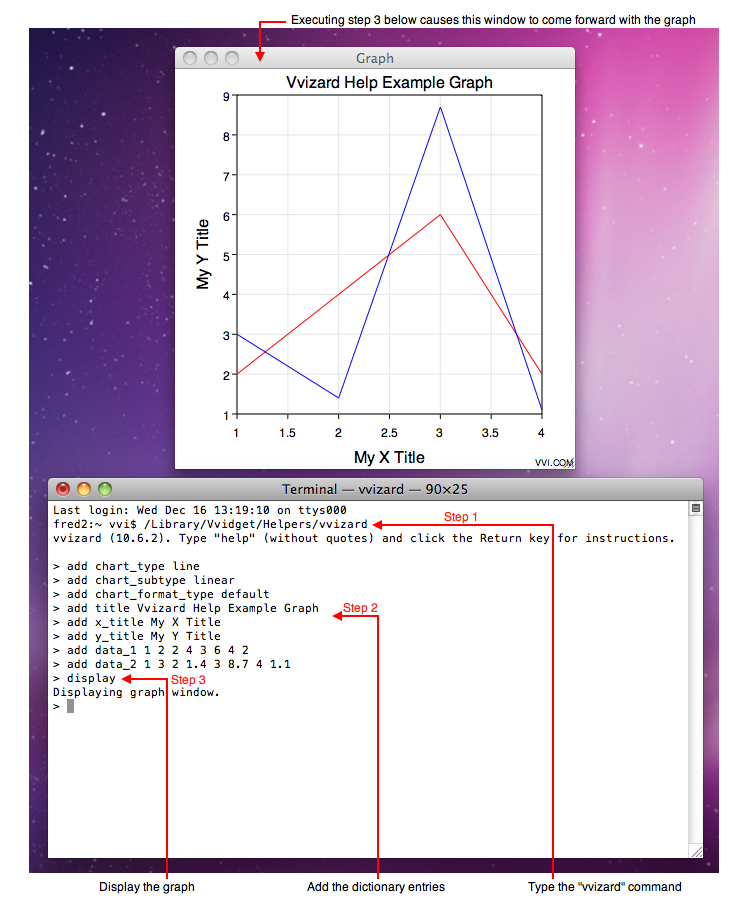
This tutorial shows how to make a graph using the Command Line Interface (CLI) of the Terminal application. It also provides the fundamentals for incorporating many 2D and 3D graph types in your scripting needs. The result of this tutorial is a situation that looks as follows on the Mac OS X screen:
The basic steps for such a situation, which are elaborated on in later sections, are as follows:
| Step | Description |
| Prerequisites | Download and install Vvidget Code. |
| Make A Graph | Launch the Terminal application, enter commands and then type "display" to display the graph. |
| Save Or Export | Once you made the graph, you can save it to the file system or type "export" to export it to Vvidget Builder for further markup. |
| Refining | With a little knowledge you can write some useful scripts. For example: once in a while I run a script to convert all Vvidget Builder documents to PNG image files for manuals. As expected, you have the latitude to insert your own data and processing into the script to make a graph. |
The following describes the steps above in greater detail. Fuller descriptions and examples are provided in the Vvidget Code Reference Manual.
Prerequisites
Download and install Vvidget Code by clicking this link: Download. Although you can write applications using Vvidget Code for free, some applications such as the vvizard process require purchase. If you have not already purchased Vvidget Code then mail sales@vvi.com for purchase details. Once installed and purchased, launch the Terminal application and type: "/Library/Vvidget/Helpers/vvizard" and then: "help" without the quotes. That will bring forward the Mail application with a registration request. Instructions are provided to register your version of Vvidget Code for vvizard CLI function.
Make A Graph
The following script makes a graph, displays it and sends it to Vvidget Builder so you can work with the graph further.
/Library/Vvidget/Helpers/vvizard
|
The following script turns the Vvidget Builder document with name you provide as an argument into a PNG image file and saves that file to the disk at the same location as the Vvidget Builder document:
#!sh
|
Save the script above in your home directory with the name convert.sh. Then the following command can be used to find all of your Vvidget Builder documents and turn them into PNG image files.
find ~ -name "*.book" -prune -execdir sh ~/convert.sh "{}" \;
|
If you have ever used the find command before then you know that upon first use and a few times after that you should backup your disk before running the command to protect you from a misplaced blank or something similar in the admittedly cryptic command.
Save Or Export
Once the graph is made you can save it or export it to Vvidget Builder for markup and also to save the resulting document. There isn't too much to the vvizard CLI as it is intended to automate production of results.
Refining
The vvizard CLI tool is straight forward and there is not much refining to do but perhaps these are some suggestions:
| • | You can keep a catalog of templates that you commonly use and refer to those in a script to customize vvizard's output. |
| • | Although this section shows the borne shell as the script engine, you are free to use any scripting system. Other Unix shells, AppleScript, PHP, RoR, Perl and Python are some that come to mind. Any script engine, or anything, that accepts stdio processing can be a candidate for vvizard scripting. |
| • | If you wish to wrap automate graph generation in a fancy GUI then you can include vvizard as a system call in another program. However, why do that when you can write a fancy Cocoa application for free. See the Cocoa Programming Tutorial section for additional information. |
Conclusion
By following the few steps above and creating a few commonly used scripts anyone can turn their computer into an automated graphing machine within minutes. Care must be taken to ensure that scripting does not get out of hand because before you know it your computer will be capable of producing more graphs than the combined graph output of the United States Government and then you will be knee deep in reports!
| Please help improve this documentation. If a section is hard to understand, there is a typo, you would like a new section added, or you detect any other improvement that can be made then please email support@vvi.com with your information. |