Table Of Contents
The Set Of 2D Points task plots curves, well not really. The longer explanation is that it plots sets of ordered sequences of pairs of scalars, but saying it plots curves is a lot easier. It also makes scatter plots and area graphs. With a little Skins manipulation it can also plot trajectories. Here are a few points regarding this task:
- The purest will not banter about the term "curve" since that is a continuous concept and computers can only do things like plot discrete points and connect those points with discretized line and spline segments but not much more. A "line graph" is equally inapplicable because a line is a straight curve without bound. Even though "curve" and "line" are really not valid terms for Set Of 2D Points tasks, in practice we tend to use those terms anyways because it is conventional and to describe things accurately can take a lot of words which garble the main ideas. But, keep in mind that there is really no plotting of lines, curves, functions or anything of that nature even though we say there is. We just plot things that approximate those other things.
- Curves are formed from the column data in a table. Area graphs are curve graphs with the portion from y = 0 filled in for each curve.
- There is no enforcement of ascending x values in the table so for line graphs you need to make sure the x values are ordered by index (they ascend in value). This caveat does not apply for scatter graphs.
- The Preference tool gives access to the 21 different representations.
- For date entry see Date Graph.
- The Bubble Graph section explains how to add and display arbitrary labels at each data point and how to add and display another dimension.
The figure below diagrams the Set Of 2D Points task.
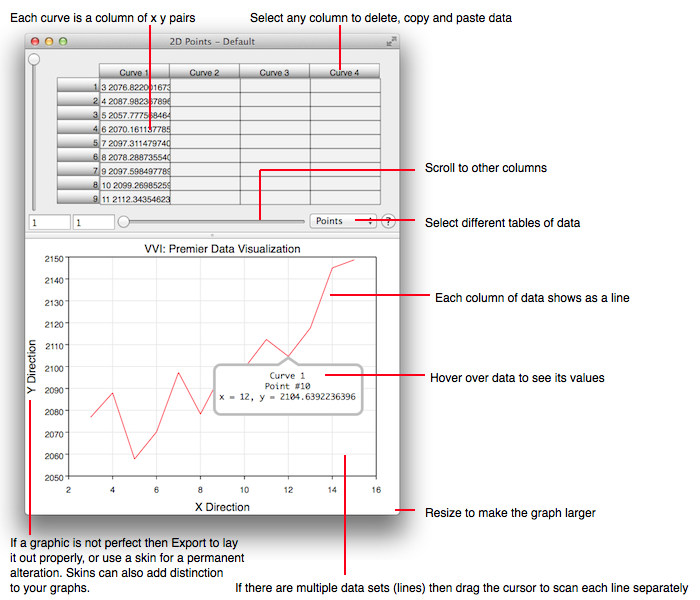
While importing data using Tables or Fetch keep in mind that the format is a list of pair of numbers (2D points) separated by a blank.
Hovering the cursor over a curve or data point shows its values. Dragging the cursor over the chart scans one column of data (curve) at a time.
See Preferences for standard preference settings. In addition, the Set Of 2D Points task has the following preferences:
| Bubble Scale Factor | Defines the scale of the bubble third dimension. Set to zero for a scatter graph effect (no 3rd dimension). |
| Label Type | None, Value or String. When setting the label type also enter the corresponding label data in either the Bubbles (Values) or Labels (Strings) table. |