Graph User Manual
Features of Graph are described in the various sections. For example, the Tasks section describes each task and the Tools section describes each tool. However, since those sections are limited by their focus they loose the big picture even in their amalgamation. This section tries to remedy that by providing a sequence of features as a narrative which may be more consistent with the way a reader thinks.
The Set Of 2D Points tasks makes line graphs.
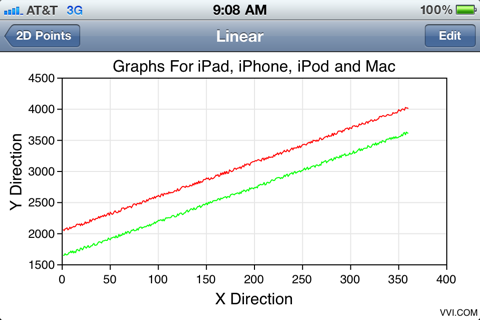
• Line graphs are a staple item. This picture shows two curves.
• Supports up to 20 curves on a single graph.
• Curve colors are defined by a color table skin, the hundreds of other graphical options are defined by the primary skin.
• Axes are set to autoscale, however they can also be set to fixed values or the autoscale parameters can be adjusted by altering the skin for this graph.
Touch to drill down on data
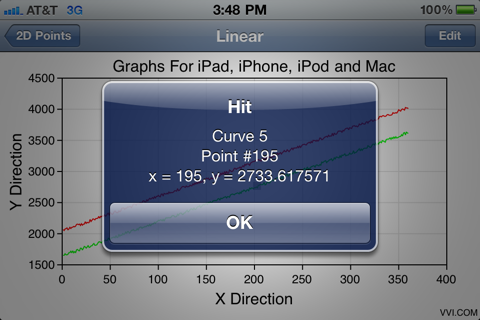
• Touch a curve to show its data.
• Touching a data point shows the values of that data while touching the curve (interpolated line segment) shows the interpolated value at the touch point.
• All the pictures shown here are in landscape format, but if you rotate the device then it shows portrait format just as you expect.
Makes non-linear graphs
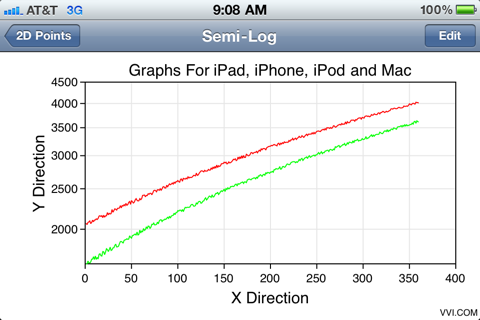
• Touch the Semi-Log entry to get a Semi-Log representation of the data.
• Log scales are automatic and there are many adjustments that can be made to the autoscale by using a skin or you can turn autoscale off.
Sub and full cycle log scales
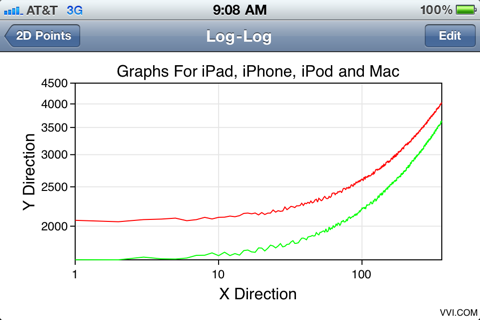
• Touch on the Log-Log 2D Points Task entry to get a Log-Log graph.
• No need to reenter the data, rather simply select the representation of the data you want.
• Touch works on non-linear graphs as well.
• Notice the sub-cycle log scale on the y-axis and the full-cycle scale on the x-axis as computed by the autoscaler.
A non-linear graph with a singularity
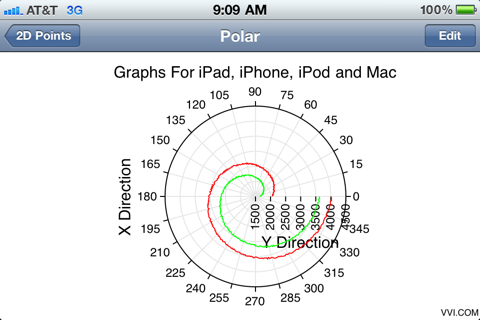
• Polar graphs can be shown too.
• Touch on the Linear, Semi-Log, X-Log, Log-Log, Polar, R-Log Polar entries for line, area or scatter plots to show the same data in different coordinates.
• The graph's titles can be set in the Graph Preference task entry or on the skin.
• Font size, type and other attributes can be set in the skin.
Can zoom in on any graph
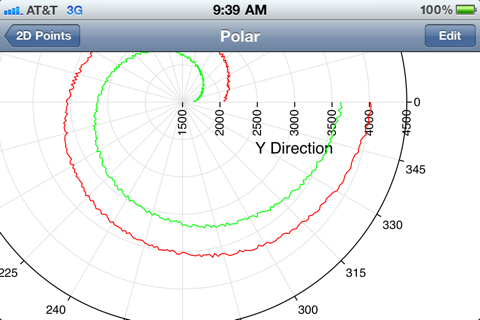
• Any graph can be zoomed and scrolled. This picture shows the polar graph above zoomed into a section of the graph.
• Touch any part of the curve to see the curve's x and y values, or in the case of a polar plot, the curve's theta and radius values.
• The radius-axis labels are rotated 90 degrees. With a skin, you can set the rotation to any value simply by dragging a dial.
Makes area graphs
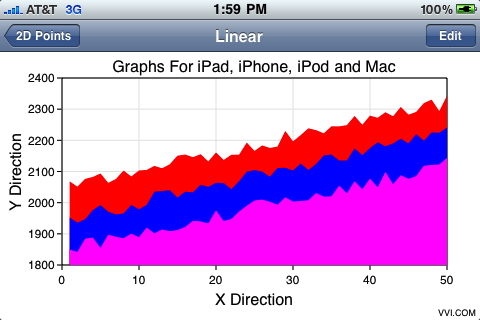
• Area graphs can be made too.
• Many of the graphs share the same data and simply present that data on a different coordinate system or with different graphical effects. In this case and area graph is simply a different graphical representation of a line graph.
• The stacked effect gives a sense of accumulated data.
• If needed, the autoscale feature can be set so that data presents to the graph frame and there is no gap. However, usually ticks are defined on some regular interval such as shown here so that the data does not fill the entire graph.
The Set Of Scalars tasks can make stacked column graphs
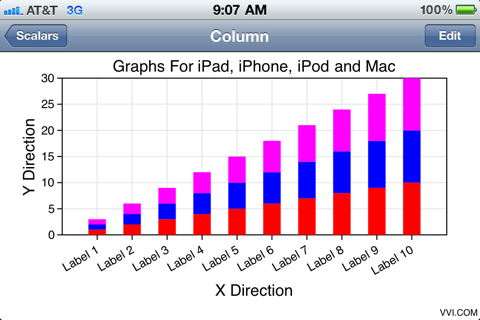
• This picture shows a stacked column bar of a set of scalar data.
• Scalar data can be represented by column, bar and pie graphs.
• Grids are on by default, however you may want to turn them off with a skin.
• Gradients can be set via a skin as well. Gradients are particularly handsome for bar and column graphs.
The Set Of Scalars tasks can make offset bar graphs
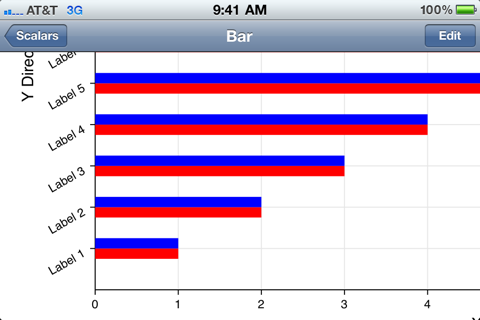
• Touching the offset bar task entry shows data in an offset bar format.
• The y-axis labels are defined by user input.
• Double touch to zoom in on the graph. The picture shows the graph zoomed into the lower left corner.
Touch a bar to get more information
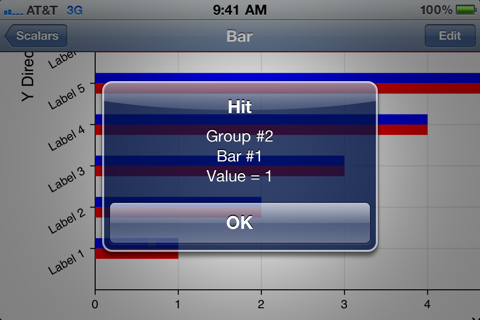
• Touch a bar to see information about its value as well as grouping indices.
• Almost all graphs respond to touches.
The Set Of Scalars tasks can make pie charts
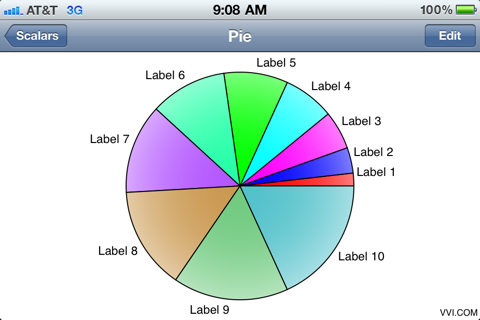
• The default pie chart with labels has a gradient effect.
• Most other graphics can also have gradients by loading in the corresponding skin set to have gradients.
• The wedge border and other attributes are also defined by skins that you can make.
Specialties like least squares is done with the The Least Squares task
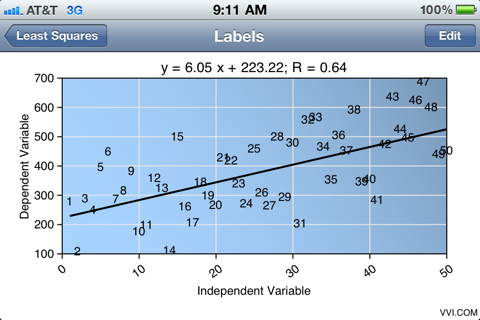
• Point data can be entered into the Least Squares task and a linear regression will be computed automatically.
• Touch the line fit to see interpolated values, or a data point to see the values at that point.
• Choose different task entries to see dots or labels at the data point.
• The background of the graph has a blue gradient effect and you can change that yourself using the appropriate skin.
A map of the USA is one of many maps you can have, see the Maps task
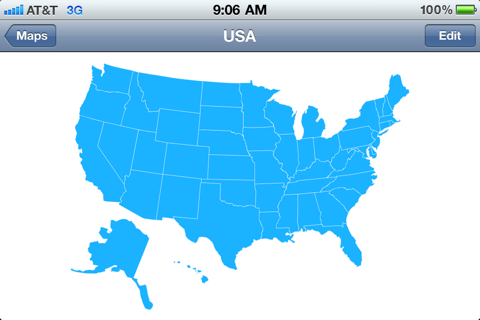
• Maps can be loaded into the Map task, in this case a map of the United States of America.
• Maps are geographic, schematic, process maps, node graphs, floor plans or any diagram.
• Make your own map and load it into the Map task by following the directions.
• When you touch on a map it shows the name that you defined for that part of the map, such as "Valve 1". If you choose to develop your own application then you can set the touch as a feedback command. For example: Touching Valve 1 opens and closes it.
Zooms in on a map
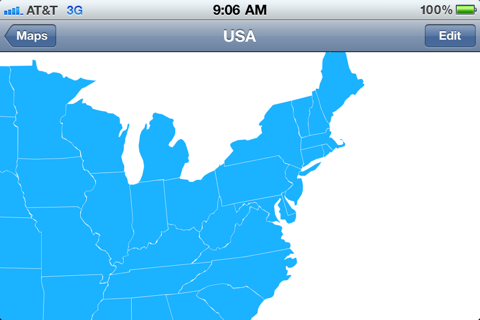
• Like any graph, maps can be zoomed in on and scrolled.
• The map of the United States is included with Graph Builder. You can use that as a starting point for your own map skin. For example, you can define state sets as sales territories and touch to see sales data.
Drill down on a map component
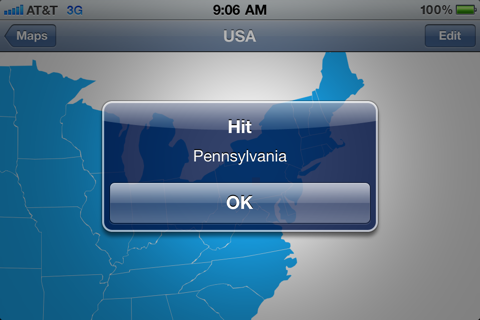
• Touching a state on the map shows its name.
• With a little programming the touch can retrieve enterprise sales data based on geography and present it to the user. For example: Who is the sales rep. in Pennsylvania and what is his phone number?
• All data can be stored on the device so users have access to it at all times and without delay.
Point fill plot on a rectilinear grid
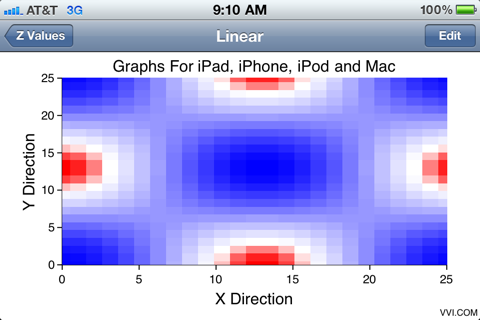
• Use the Z Values task to show a point fill of scalars on a regular grid.
• Although associated with Z-Values, a point fill plot can show any 2D density representation.
• Entries are available for all the graph coordinates, i.e.: Linear, Semi-Log, X-Log, Log-Log, Polar and R-Log Polar.
• Simply touch different Task Entries to see the point fill plot on different coordinate representations.
Point maps do touches too
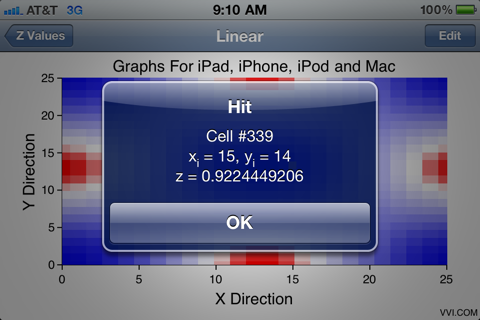
• Touch the point fill graph to shows the grid indices and amplitude of the data at the touch point.
• If you develop using the Vvidget library then touches can be intercepted to perform nearly any task upon a touch. See the Event Qualifier sections in the Vvidget Code Reference Manual.
A surface graph
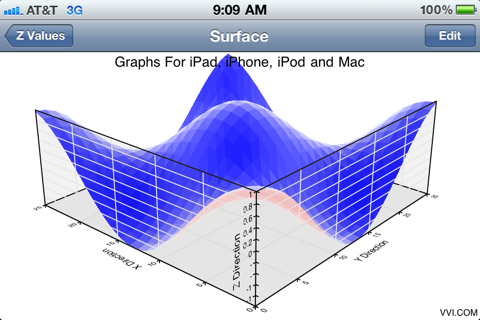
• This picture shows a 3D perspective surface chart.
• The surface chart is defined by scalars on a regular grid, same as for the point fill plot. Both are different representations of the same data and are hence associated with the same Task.
• Color mappings are defined in the skin.
Zooms in on 3D perspective graphs
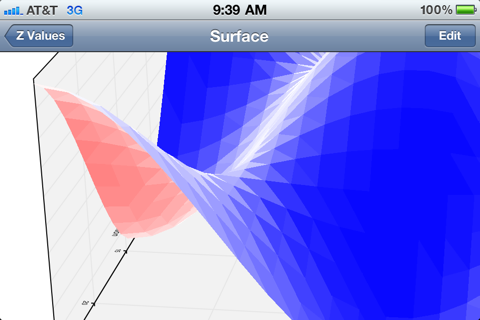
• Double touching the surface chart zooms into it just as a double touch does for any graph or map.
3D scatter plot
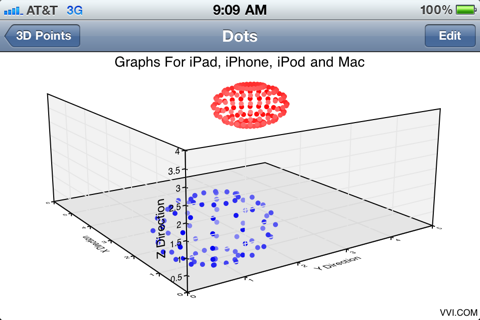
• This picture shows a 3D perspective scatter plot.
• Touch drag rotates the graph.
3D does touches too
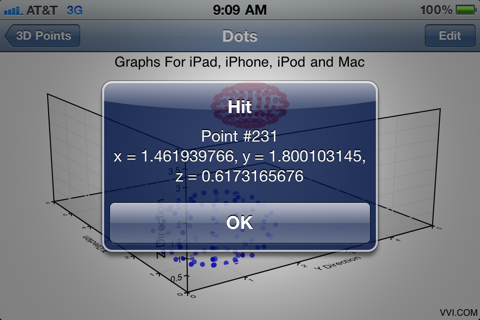
• Touching a 3D point on the graph gives its 3D point values.
• A combination of rotate and zoom helps to bring forward and separate the data point to touch.
• A combination of touch, graphical effects and programming can permit intricate exploration and querying of 3D data.
Volumetric density plot
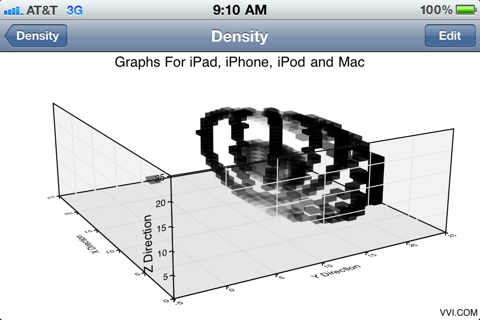
• This picture shows a volume graph.
• A volume graph is a representation of density values on a 3D regular grid shown by color coded cubes.
• The color v.s. density mapping is defined through a skin.
Z-slice volumetric data and drill down on it too.
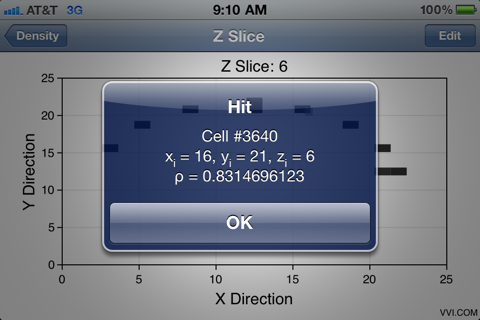
• This picture shows a z-slice of volume data.
• Touching a density values shows cell values and density values.
• The volume density values can be panned through z-slices by touch-drag horizontally or by animation.
Organize by projects
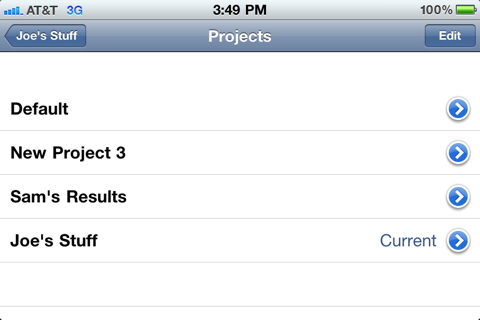
• Data and preferences are organized by projects.
• You can make as many projects as you wish.
• Projects help organize tasks along project boundaries so you can work on one project without affecting another.
Insert data using textual methods
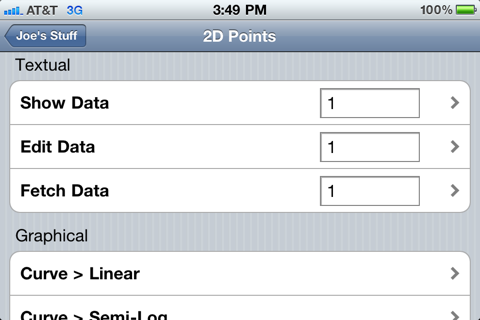
• This picture shows the task textual entries for the 2D Points task (line graph a.k.a. curves).
• There are 3 ways to acquire data, using a tabular entry (Show Data), using a normal text view to copy, paste and key in data with the keypad (Edit Data) and fetching data from a URL which can reference a web server or shared file entry (Fetch Data).
• Touching a task textual entry navigates to that entry's input mechanism.
Fetch data from anywhere on the web
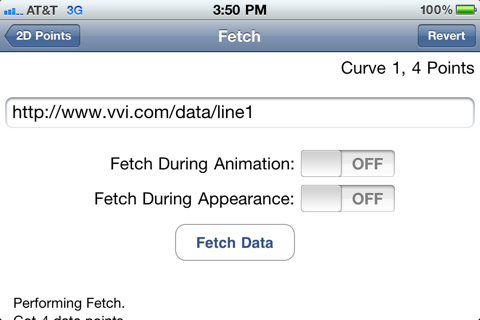
• This picture shows the Fetch Data task entry.
• Enter a URL and then touch the Fetch Data button.
• Data is retrieved from the URL. The URL can point to something as simple as a flat file, or can point to a web server CGI service which can, for example, access a database.
• Once the data is fetched then it resides on the device and does not have to be retrieved again. However, you can also setup fetch during first viewing or animation to reacquire data without touching the Fetch Data button.
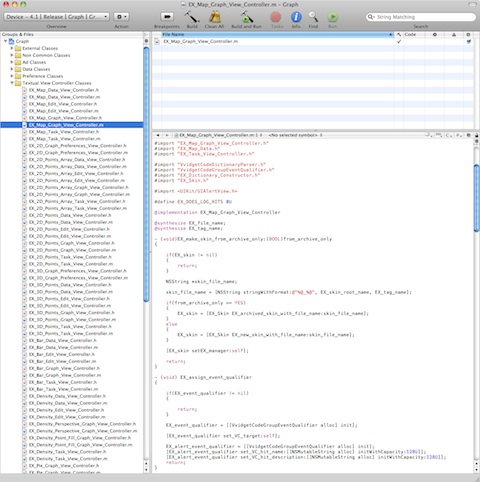
One more picture ...
Most people desire results without programming. The Graph application is based on one principle: "You give it data and it gives you a graph". That is straightforward and the way it should be. It also employes skins which adds more features but with an increased level of indirection and complexity. If you don't mind the default visuals of the Graph application then you need not be concerned with skins.
There are also people and companies that prefer more automation and specific features for their own operations. But, they also do not desire a huge investment in data visualization programming. For that situation the Vvidget library may meet those needs. For additional information email info@vvi.com.
• One more picture. In this case, showing the Xcode project for the Graph application.
• The Graph application does not require any programming and can be used right away. Skins are made with Graph Builder, an optional Mac OS X application, and although it is a complex application it also requires no programming to access all its features.
• The Vvidget library, documented at Vvidget Code Reference Manual is based on about a million lines of code, or so, but that isn't really of any concern since it comes as a prepackaged library that can be inserted into applications, such as this Graph application, without any programming at all.
• This Graph application is about 30,000 lines of code, a million characters and 100 classes in scope. That is a lot of typing by itself but is still small because it leverages against the much larger project of the libraries.
• If you do choose to program a data visualization application then your use of Vvidget may be as little as a handful of code, perhaps a few dozen lines.
• If you do not want to program at all then this Graph application is for you. No programming, just results based on data inserted.
• If you seek greater features then there are options available from VVI, the leading expert in the field of data visualization on iPhone, iPad and iPod touch as well as Mac OS X.