Graph ► Tasks ► Set Of Scalars
The Set Of Scalars task shows, among other things, bar graphs. Here are a few things to note about this task:
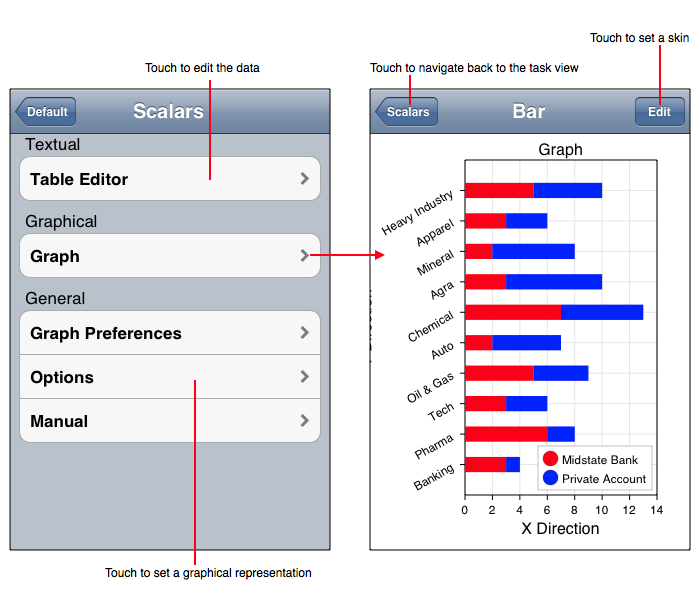
The figure below diagrams the Set Of Scalars task.
Data Importing and Exporting Formats
Representations
The Set Of Scalars tasks implements the representations described in the following table. Remember that Skins can affect the representation and may even alter the representation to not conform to the following descriptions.
| Representation | Description |
| Bar > Offset > Half | Shows a usual bar chart which has the following attributes: The bars are half the distance from each other, lengths oriented horizontally and sets of scalars are represented by successive offsets from the label for the particular scalar sequence index. The y-axis label is an integer or if the number of bars is too great then sparse integers unless (custom) labels are assigned. |
| Bar > Offset > Full | Same as Bar > Offset > Half except the bars touch each other. |
| Bar > Stacked > Half | Shows a stacked bar chart which has the following attributes: The bars are half the distance from each other, lengths oriented horizontally and sets of scalars are represented by successive summation of values for the particular scalar sequence index. The y-axis label is an integer or if the number of bars is too great then sparse integers unless (custom) labels are assigned. |
| Bar > Offset > Full | Same as Bar > Stacked > Half except the bars touch each other. |
| Column > Offset > Half | Shows a usual column chart which has the following attributes: The bars are half the distance from each other, lengths oriented vertically and sets of scalars are represented by successive offsets from the label for the particular scalar sequence index. The x-axis label is an integer or if the number of bars is too great then sparse integers unless (custom) labels are assigned. |
| Column > Offset > Full | Same as Column > Offset > Half except the bars touch each other. |
| Column > Stacked > Half | Shows a stacked bar chart which has the following attributes: The bars are half the distance from each other, lengths oriented vertically and sets of scalars are represented by successive summation of values for the particular scalar sequence index. The x-axis label is an integer or if the number of bars is too great then sparse integers unless (custom) labels are assigned. |
| Column > Offset > Full | Same as Column > Stacked > Half except the bars touch each other. |
| Pie Chart | Each set element of sequence of numbers is represented by a pie chart where each wedge has a arc-length proportional to the scaler it represents divide by the sum of scalars in the sequence. Note that only one pie chart can be shown at a time. In the case where there is more than one element of scalars then pan through the set by touch drag from left to right. |