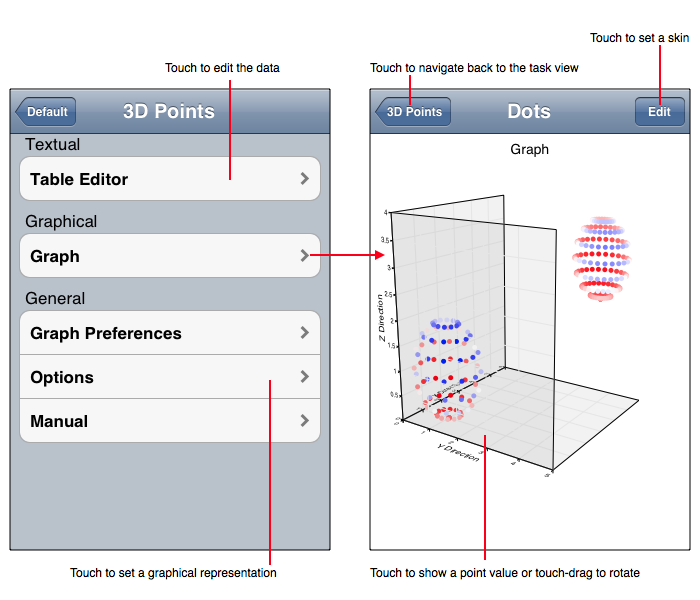
The 3D Points task makes 3D scatter plots of a sequence of triplet of numbers. It also makes 3D trajectory plots. Touching a point shows its value while touch-drag over the chart rotates it.
The figure below annotates the 3D Points task user interface.
Data Importing and Exporting Formats
Representations
The 3D Points tasks implements the representations described in the following table. Remember that Skins can affect the representation and may even alter the representation to not conform to the following descriptions. If you need a combination of these representation types, such as a trajectory plot with each point marked by a dot (a combination trajectory and scatter plot) then set that in a skin.
| Representation | Description |
| Perspective With Dots | Shows a 3D perspective scatter plot on a 3D rectilinear coordinate system. Each 3D data point is denoted by a dot which is a small red circle. The dot (a marker) can be altered using Skins. |
| Perspective With Labels | Shows a 3D perspective scatter plot on a 3D rectilinear coordinate system. Each 3D data point is denoted by a number which is the sequence index of the point. The number font and other graphics can be altered using Skins. |
| Perspective With Lines | Shows a 3D perspective trajectory plot on a 3D rectilinear coordinate system. Each 3D data point connected by a line to adjacent points. The line width, dash and other graphical effects can be altered using Skins. |