Graph ► Tasks ► Density Values
a.k.a: Scalars On a Regular 3D Grid
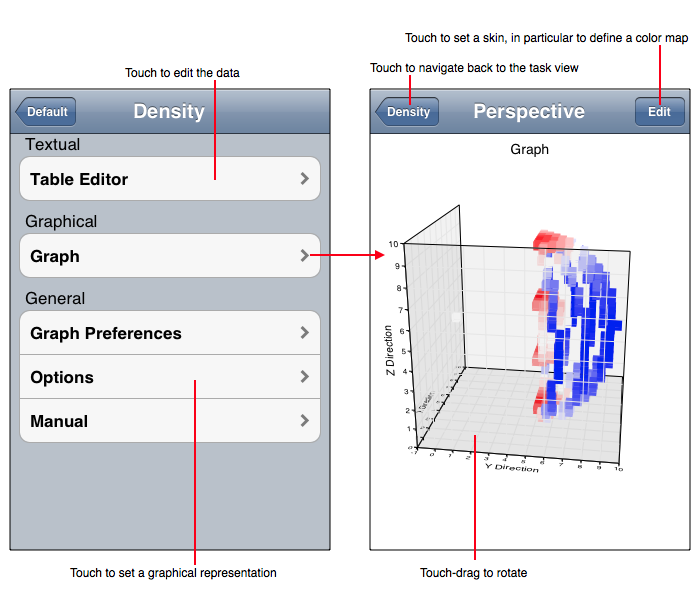
The Density Values Task takes a sequence of scalars and presents them as boxes on a uniform 3D grid. The scalars have values between 0 and 1 and any value outside that range (especially -1) means "no density". By selecting one of the point fill representations densities can be scanned in the z-direction one x-y plane at a time by touch drag over the point fill plot. Here are a few things to note about this task:
The figure below diagrams the Density task.
Data Importing and Exporting Formats
Representations
The Density Values tasks implements the representations described in the following table. Remember that Skins can affect the representation and may even alter the representation to not conform to the following descriptions.
| Representation | Description |
| Perspective Volume | Shows a 3D perspective volumetric plot on a 3D rectilinear coordinate system. Each density value is denoted by a cube on a 3D regular grid. The cube color, which corresponds to density, can be altered using Skins. By selecting color maps with appropriate transparency the density can be semi-translucent so that inner portions of the density can be viewed. |
| Z Slice | Shows a single plane of the density on a rectilinear coordinate system. In this representation, the z-plane can be panned by touch-drag from left to right. |