Graph ► Tasks ► Z Values
a.k.a: Scalars On a Regular 2D Grid
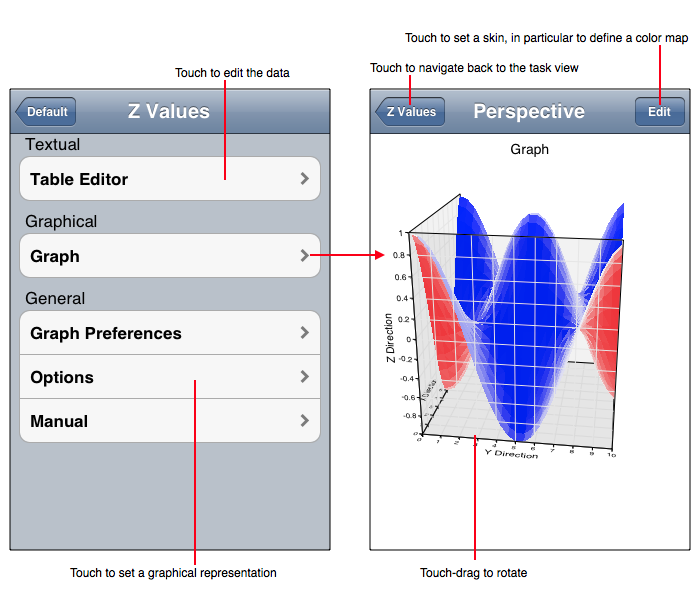
The Z Values task interprets a list of numbers as x-contiguous z-values on a x-y regular grid. The z-values correspond to height of cells on a 3D perspective plot or as cell amplitude on point fill plots. Some things to note about this task follow:
The Z Values task is diagrammed in the following figure.
Data Importing and Exporting Formats
Representations
The Z Values tasks implements the representations described in the following table. Remember that Skins can affect the representation and may even alter the representation to not conform to the following descriptions.
| Representation | Description |
| Perspective Surface Graph | Shows a 3D perspective surface graph on a 3D rectilinear coordinate system. Each Z Value is bi-linearly interpolated with adjacent values to form the surface. The color gradation can be altered using Skins. |
| Perspective Grid Graph | Shows a 3D perspective surface graph on a 3D rectilinear coordinate system. Each Z Value is connected to adjacent values by a line segment to form the grid. |
| Point Fill Graph > Linear | Shows each Z Value mapped to a color within a rectangle of the regular grid cell on a 2D rectilinear coordinate system. The color map can be altered using Skins. |
| Point Fill Graph > Semi-Log | Same as Point Fill Graph > Linear except for a semi-log coordinate system (x-linear, y-log). |
| Point Fill Graph > X-Log | Same as Point Fill Graph > Linear except for a x-log, y-linear coordinate system. |
| Point Fill Graph > Log-Log | Same as Point Fill Graph > Linear except for a x-log, y-log coordinate system. |
| Point Fill Graph > Polar | Same as Point Fill Graph > Linear except for a polar coordinate system. |
| Point Fill Graph > R-Log | Same as Point Fill Graph > Linear except for a polar r-log coordinate system. |