These settings are mainly used for shell scripts and automated output to a web server resource.
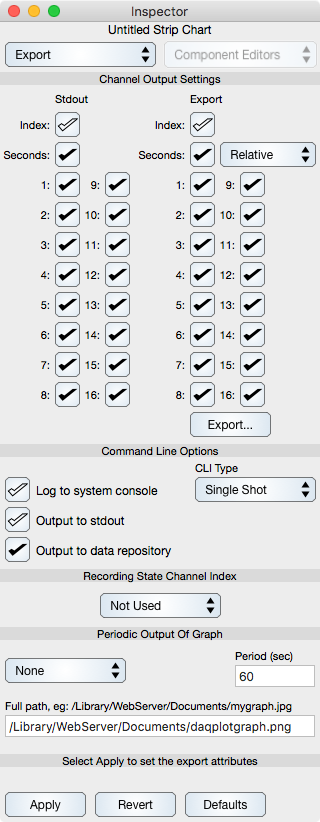
Channel Output Settings
Stdout : Defines which channels output to stdout, which can then be used as input to a shell script. By selecting only the channels you are interested in you can minimize the amount of output processed by the shell script.
Export : Defines which elements get output to tab-delimited text output formats. The options are index, second and channel values. The seconds can be output in relative values (0 being the first sample time), absolute seconds since 1/1/1970, or Full Date format which is a Gregorian date format.
Export... : Select the Export... button to save the data. Before doing this make sure to first Apply the Export settings by selecting the Apply button. The data can also be exported using table export functions in the Strip Chart inspector editor.
Command Line Options
Log to system console : If checked then a log of all text messages will be directed to the system console in addition to the Strip Chart console, otherwise those text messages will only appear on the Strip Chart console. This is good for making a permanent log of events.
Output to stdout : If checked then the Export Channels (seconds and amplitude values) will output to stdout in addition to the graph and other UI locations. This must be selected for use with a shell script.
Output to data repository : If checked then the acquired data is stored to the internal buffers of Strip Chart. Keep this on during normal use, but turn it off if configuring for a shell script.
CLI Type : If "Single Shot" is selected then the DAQ Command will only execute one iteration of an acquisition. If "Continuous" is selected then the DAQ Command will output at the sample interval defined in Strip Chart. That sample interval value is shown in the main window as well as the Data preference tab.
Recording State Channel Index
Sometimes it is convenient to have an external source control the recording of data. For example, a manual button for turning on and off acquisition. The idea is to get an actual hardware toggle switch (like a low power light switch) so you can manually turn recording on and off, just like a light bulb. In addition, such a feature can be used in conjunction with sensor feedback, so for instance if something reaches a certain temperature then acquisition can turn on. The idea of using a hardware switch and not the computer screen seems to be better accepted because the switch can be located next to a machine with sensors and is easy to understand for operators. In addition, such a feature is indispensable for high sample rates where manually turning recording on and off fast enough is impossible.
The Recording State Channel Index defines which analog input channel is used for the purpose described above. If the voltage for that channel is equal or greater than one then recording is on, otherwise it is off. The Recording State Channel Index pop up button defines this channel. The default selection is "Not Used" meaning that all analog input channels are used to record voltage data (hence there is no recording state feature). When a channel index number is selected then the corresponding analog input channel is used for the mentioned purpose. Note that the signal unit for this feature is voltage, not calibrated amplitude. Also note that while recording is off, data acquisition is still on. This is needed so Strip Chart can determine when to turn recording back on according to the value of the voltage on the recording state channel.
Periodic Output Of Graph
If on, then the Strip Chart will be written to disk according to the following parameters:
Output Type : If set to PNG then a PNG image will be written. Otherwise no output will be written.
Period : Defines the period in seconds to save the graph output. For example if set to 60 then the graph will be written every minute to the specified Full path.
Full path : The absolute path on the file system of the computer Strip Chart runs on to save the image. The directory of this path must exist and you should specify it as an absolute path (with a leading slash) and also specify the file name with extension png. It goes without saying that you need privilege to write to this path and for sandboxed environments it must be in a user authorized location.
The intended use is to output for web distribution so the Full path should be in the Document root of your web server configuration. However, the graph can be written anywhere accessible to Graph IDE.