Strip Chart™ User Manual
Revision 5.0.2 (12.11.3)
— February 15, 2021 —
By VVI ®
www.vvi.com
Strip Chart provides time series analysis from a variety of sources including electrical and IOT (Internet Of Things) signals. It also provides some output capabilities to implement feedback loops and filtering transformations. It has special provisions for handling millions of time points at one time and sample rates approaching millions of samples per second. It accomplishes that through a combination of multithreading, multiple buffering (both linear and circular) and resampling. In addition, because Strip Chart is embedded into Graph IDE it also implements all the features of a general purpose graphing application.
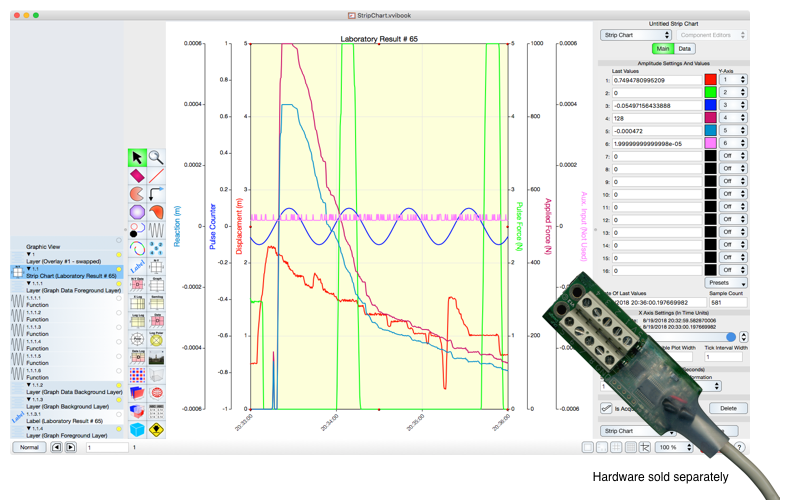
Its main interface looks like this:
Selecting the Is Acquiring button starts the process. But, first you need to attach a compatible analog to digital converter (DAQ Hardware) to your computer and configure it. Alternatively, you may use a URL Device or simply import existing time series data using the Strip Chart inspector editor Data Editor.