Amplitude Settings and Values
These settings control the display of amplitudes (see Glossary for a definition of amplitude). Each amplitude is given an index from 1-16 and is called the channel index.
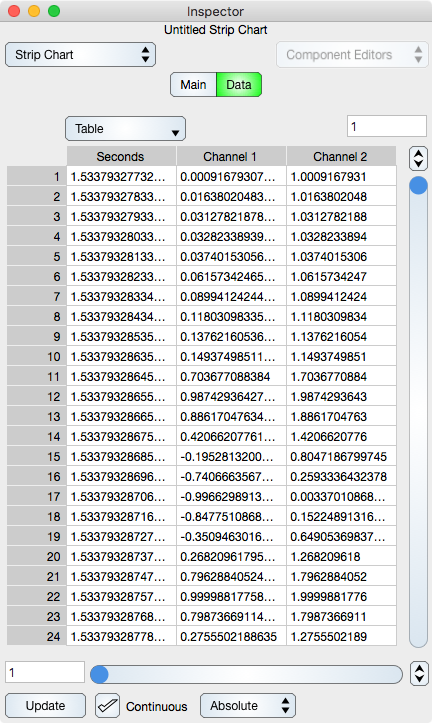
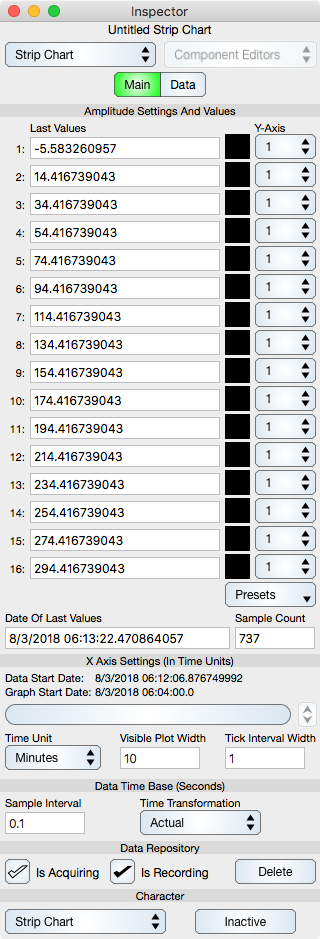
Last Values : Shows that amplitude's last value collected.
Y Axis Colors : Shows and changes the color of the associated curve. Select the color to change its value.
Y Axis Pop Up Button : Defines which y-axis is associated with the amplitude index and is used to select a number from 1 to 16, or Off if the amplitude is not to be displayed. Consult Multi Y-Axes for additional information.
Date Of Last Value : Shows the time (Gregorian date) at which the last values where sampled.
Sample Count : Shows the number of samples collected. This is often the same as the last value time index but may be different if for example data is collected by appending data to existing data.
Presets : Use this to set all amplitudes to a preexisting setting.
X Axis Settings
Slider : The scroll bar defines the number of ticks scrolled back in time. This does not have a valid effect when the x-axis is autoscaled. Note that the slider unit is in terms of the Time Unit of the x-axis.
Time Unit : Sets the x-axis unit from seconds to years or automatic. Automatic shows all the data. When the unit is changed then the data is scrolled to the leading edge (the last time point).
Visible Plot Width : Sets the number of time intervals on the x-axis. For example, 10 seconds, 5 days, etc.
Tick Interval Width : Sets the width between ticks in time units, for example 1 hour per tick, 5 seconds per tick, etc. The total x-axis time span is the Tick Interval Width times Visible Plot Width.
Date Labels : The labels above the scroller show the data start date and the graph x minimum value in terms of Gregorian date. When panning or collecting data the data start date remains fixed however the graph start date will increment or decrement depending upon settings.
Data Time Base
Sample Interval : The time base defines the time-discretization of the signal and also the acquisition animation time step. The Sample Interval defines how many times per second values are sampled, or more appropriately, the seconds between sampling. If a device is in segment-mode (such as for hardware clocking) then the Sample Interval represents the speed at which the user interface is updated and not the sampling time of the actual data.
Time Transformation : When set to Actual then each data point is shown at its absolute time value. When Continuous then gaps in the data acquisition are shifted down in time to the last sampled value. A gap will occur only if the data acquisition is stopped and then started again.
Data Repository
Is Acquiring : When selected then the acquisition of data is on. Before acquiring data set the device type using the Device inspector editor.
Is Recording : When selected then acquired data is recorded into the data repository. The data repository is a buffer where all data is accumulated and is either a circular or linear buffer. If off then the data is not recorded, however the last values are shown in the Amplitudes fields described above. Typically, recording is left on however it may be left off for use by shell script input (see the Export inspector editor).
Delete : When selected then data within the data repository is deleted. Another term for this is Clear. The backup file, if on, is also deleted from the file system.
Character
Strip Chart : Select this pop up button to change back to the Universal character which is a general Multiple Coordinate Graph. If you choose Delete Specialization then the collected data and any strip chart related attributes are permanently deleted and can not be recovered.
Inactive/Active : Select to activate the event qualifier. When active, hovering over data curves shows the curve's data value.