Graph
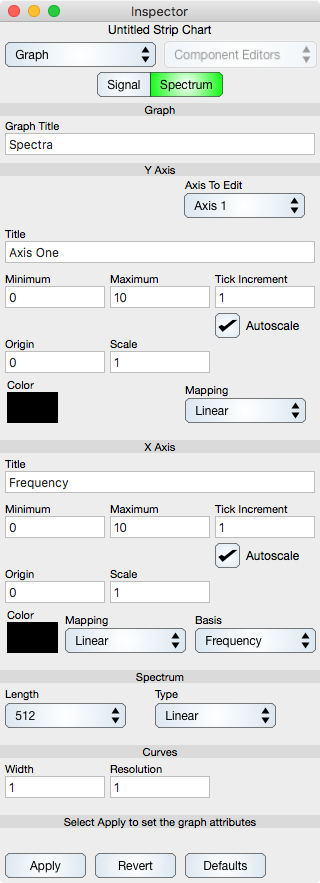
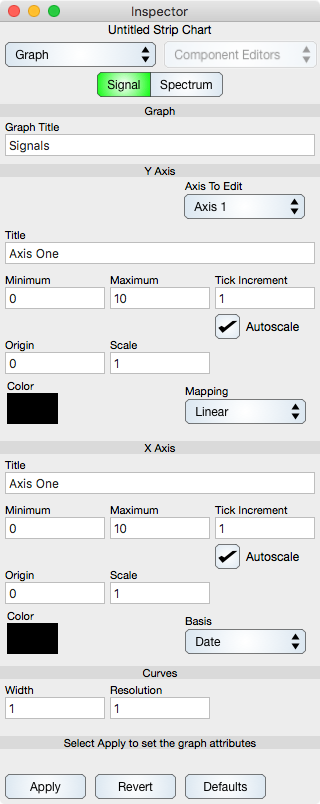
Graph Title : The graph title can be set using this field.
Each y-axis attributes can be adjusted per the input fields. First select the axis number to edit and then set the parameters for that axis.
Common Axis Attributes:
Title : The title of the y-axis.
Minimum, Maximum and Tick Increment : The y-axis limits. The axis is autoscaled by default. If you do not want autoscaling then turn that off in which case the Minimum, Maximum and Tick Increment values are used instead.
Origin and Scale : Remaps the axis label values according to the linear mapping. Since there are many other remappings possible it is probably best to leave these at their default values (identity mapping) otherwise things get confusing. The origin and scale attributes only change the graph label values. If you need to alter the data values with a linear mapping then see the Mapping inspector editor.
Color : Defines the y-axis title color. To associate a y-axis to a curve (color) set both to the same value. Remember: Click the color well to bring up the color selector.
Mapping : Applies to the y-axes only and is either linear or log.
X-Axis Basis : Normally the x-axis is time and date. But, you can alter that by selecting a different x-axis basis. The basis is either Sample Index or another channel. For example, if it is Channel 1 then other channels (such as channel 2) have their normal y-value, but their x-value is that of channel 1's y-value. Such plots are called many things including trajectory plots, scatter plots, phase space plots, x-y plots, etc.
Linear X-Axis Attributes: When the X-Axis Basis is not Date then it is a normal linear axis and the attributes are similar to the y axis attributes.
Curve Attributes : The width and fidelity of each curve can be altered using the appropriate settings. Resolution is normalized to one pixel on a screen and should remain 1 while plotting. You may want to set it to 0 before exporting a graph for the maximum resolution, but after exporting set it back to 1. For screen display, any value less than one is overkill.