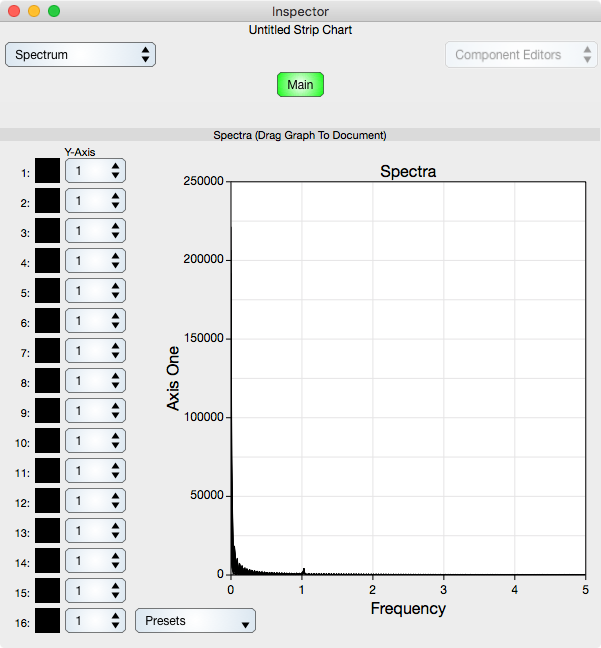
Y-Axis settings
Y Axis Colors : Shows and changes the color of the associated curve. Select the color to change its value.
Y Axis Pop Up Button : Defines which y-axis is associated with the amplitude index and is used to select a number from 1 to 16, or Off if the amplitude is not to be displayed.
Other spectrum settings are set in the Graph Inspector Editor, specifically the FFT length and amplitude unit (dB or linear).
Note that the FFT is taken from the right portion of amplitudes shown on the strip chart. Panning back in time will alter the spectrum because domain of the transform is from that data shown on the leading edge of the strip chart. If the strip chart always shows the last data collected (as when the time unit is Automatic) then the spectrum is from the last collected data.
Graph
The graph shows the spectrum. The graph can be dragged to the document that the strip chart is on. When that is done then the spectrum is connected to the strip chart and animates along with the strip chart when data is collected.