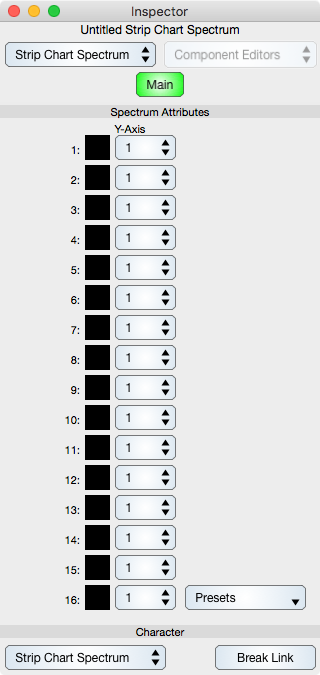
Amplitude Settings and Values
These settings control the display of amplitudes (see Glossary for a definition of amplitude). Each amplitude is given an index from 1-16 and is called the channel index.
Y Axis Colors : Shows and changes the color of the associated curve. Select the color to change its value.
Y Axis Pop Up Button : Defines which y-axis is associated with the amplitude index and is used to select a number from 1 to 16, or Off if the amplitude is not to be displayed.
Character
Strip Chart Spectrum : Select this pop up button to change back to the Universal character which is a general Multiple Coordinate Graph. If you choose Delete Specialization then the link to the strip chart is removed however the strip chart data and attributes (being a separate graph) is left intact.
Break Link : Select to break the link to the strip chart.