Strip Chart ► Overview ► Multi Y-Axes
When you first use Strip Chart, you should configure it with the minimal amount of amplitudes. You do that by these steps:
The result of the above is probably a bunch of no-ops. That is: You simply want to plot a voltage. However, it may be that your amplitudes represent different units such as force, displacement, logic states, intensity of light or other things. In that case, the y-values may have very different scales and it doesn't make sense to plot all the curves on one y-axis. For that situation, there is the multi-y-axes representation. Use the Y-Axis pop up buttons on the Strip Chart inspector editor to associate the amplitude index (curve index) with the y-axis index. y-axis indices are numbered from in to out in sequence, that is: 1 is the left axis, 2 is the right axis, 3 is the 2nd left axis, 4 is the 2nd right axis and so forth. You should make the amplitude to y-axis mapping in such a way that all consecutive y-axis indices are used.
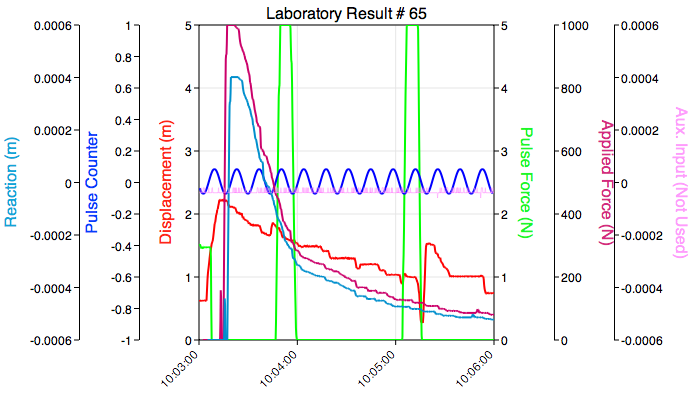
The figure below shows one such example.
The curve colors and y-axis title colors have been set to show the relationship between data and y-axis. Moving the cursor over the curve will also show that relationship in a pop over when the strip chart is made Active in the Strip Chart inspector editor.
In order to format the graph with minimum y-direction size, click on a y-axis index pop up button. That will refit the graph at that time. The refit depends on the current axes limits so you may want to refit every so often. As your need for y-axes increases so will your screen size. You may need to make Strip Chart's main window very wide to accommodate all of your y-axes.