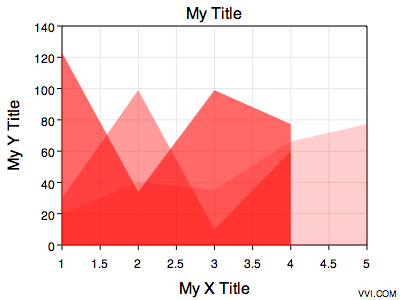
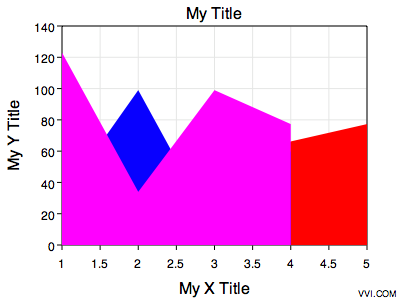
| Format One, Area Color Overridden With Red | Format One, Area Color Mapped |
 |  |
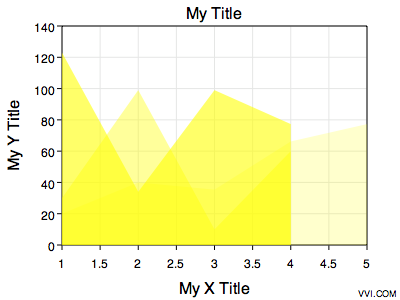
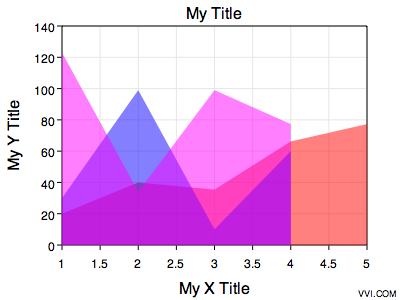
| Format Two, Area Color Overridden With Yellow | Format Two, Area Color Mapped |
 |  |
Vvidget Code > Dictionary > Area Graph
This section explains how to form a dictionary for an area graph such as these:
| Format One, Area Color Overridden With Red | Format One, Area Color Mapped |
| |
| Format Two, Area Color Overridden With Yellow | Format Two, Area Color Mapped |
| |
An area graph is essentially a line graph where the area under the curve is given a color and is part of the graphical description of the data. Note that by "under the curve" one typically means the area bounded by the curve and the y = 0 line and bounded on either side by the minimum and maximum x-values of the data. The curve is actually the connected segments of the sequences of x y pairs of the data. This defines the "fill region" of the graphical representation. So, whereas people usually say "area under the curve" they actually mean under or above the curve relative to the y = 0 line.
One must ask: What happens when the graph limits run from y = 5 to y = 10 ? That means the area portion is outside the graph, 5 units down from the bottom of the graph frame. That is correct. If you need an area representation for that situation and do not like the area extending beyond the graph frame then you can turn the graph clipping on in the template.
Notice how the alpha channel on the fill color is being used to provide information for overlapping areas, thus permitting underlying data to be viewed and also giving a sense of order. Conversely (or in addition) the y-values of the various segments for a particular x-value can be ever increasing and the fill color opaque which will give the usual stacked area graph effect.
An example code fragment illustration follows:
/* Start of Illustration Code Fragment */
|
The code fragment above can be inserted into the illustration code section of the Illustration project for an immediate running Cocoa application. For additional information consult the Illustration section.
The following table defines the dictionary key and value pairs:
| Chart Specific Entries | |
| Key | Value Description |
| chart_type¹ | The chart type is the string area, indicating an area graph. |
| chart_subtype¹ | One of the strings {linear , semilog, x-log y-linear, log-log, 2y-linear, polar, r-log} which specifies the graph coordinate type of {X-Linear, Y-Linear}, {X-Linear, Y-Log}, {X-Log, Y-Linear}, {X-Log, Y-Log}, {X-Linear, Y1-Linear, Y2-Linear}, {R-Linear, Theta-Degrees}, {R-Log, Theta-Degrees} respectively. |
| chart_format_type¹ | One of the strings {default, alternate}. |
| title | The main title of the graph. If this key is not present then the template's title is used. |
| x_title | The x title of the graph. If this key is not present then the template's x-title is used. |
| y_title | The y title of the graph. If this key is not present then the template's y-title is used. |
| data_I | A white space delimited list of values representing the x and y values of points in a sequence for curve index I where I starts at 1. See Data Oriented keys for additional information and keys. |
| label_I | A string for the I-th x-label value. I starts at 1. NOTE: If any label key is present then the data x-values are assumed unitless and an arbitrary unit must be assigned. The x-axis minimum starts at zero and runs to (N-1), where N is the maximum label index. To place a data point at each label x-value the data x-values should be the sequence {0, 1, 2, ..., (N-1)} but you may also choose to skip locations where a label is, etc. |
| area_color | A hex encoded representation of a RGBA color value for the area fill color. If this key is not present then the color table template is used. |
| templates | A custom Templates directory. |
¹ Do not include this key value pair in the Interface Builder Plugin Inspector input string. It is included for you automatically.
If you incorporate this functionality into your own application then please consult Cocoa Programming. If you incorporate this functionality into CLI scripts then please consult Script Programming.
You can also modify the following Templates:
| Template Document Names | |
| Template | Description |
| PVST_Area_Graph | Forms the static attributes for the X-Linear, Y-Linear graph. |
| PVST_X_Log_Area_Graph | Forms the static attributes for the X-Log, Y-Linear graph. |
| PVST_Y_Log_Area_Graph | Forms the static attributes for the X-Linear, Y-Log graph. |
| PVST_XY_Log_Area_Graph | Forms the static attributes for the X-Log, Y-Log graph. |
| PVST_2Y_Area_Graph | Forms the static attributes for a two y-axis graph. The y-axis can be of any type (linear, log, etc.) that can be made in a template. |
| PVST_Polar_Area_Graph | Forms the static attributes for a polar graph. |
| PVST_R_Log_Area_Graph | Forms the static attributes for a log-polar graph (r-log). |
| PVST_area_color_table | Forms the area colors for odd format type indices. |
| PVST_area_color_table_1 | Forms the area colors for even format type indices. |
This Area graph image maker inherits the Vvidget prototype definitions of the Line Graph image maker.
| Please help improve this documentation. If a section is hard to understand, there is a typo, you would like a new section added, or you detect any other improvement that can be made then please email support@vvi.com with your information. |