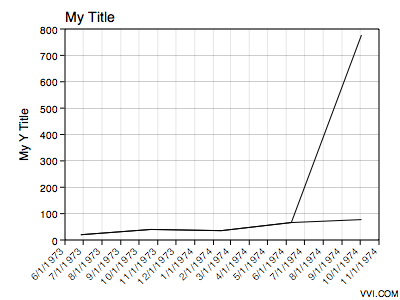
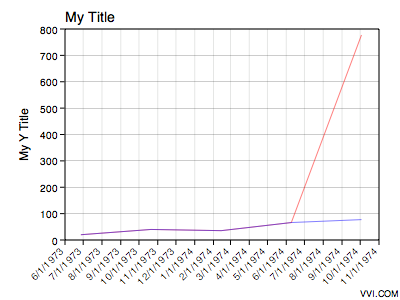
| Single Color Date Graph | Multiple Color Date Graph |
 |  |
Vvidget Code > Dictionary > Date Graph
This section explains how to form a dictionary for a date graph such as these:
| Single Color Date Graph | Multiple Color Date Graph |
| |
A date graph is a line graph but with x-values that have the unit of seconds since 1970 (which is the time of creation for the Unix world) and the x-labels given text according to some "natural" units of time within the Gregorian calendar system. A date graph is nearly unheard of in mathematics, is used often in financial analysis, and is used with sporadic utility in engineering. A date graph is a most intuitive representation and also the most obtuse if you think only in terms of uniform time. After all, time marches on at the same rate as long as we are all moving at the same speed or in the same gravitational field. But because of the moon, astrologically nonuniform events and political reasoning time is thought of in terms of non-uniform units (such as 28 days for February and 31 days for other months and complete days being removed a long time ago) which makes a date graph a challenging thing to implement. Don't expect too much from a date graph in terms of domain width because the [Gregorian] calendar is not very old and has not yet been made in future time. But no doubt its specification will probably be predictable for the next year or two.
The date autoscaling parameters are defined by the associated template. In addition, regions of the graph can be demarcated by daytime and nighttime, which is a further non-uniformity as those are dependent upon location on the earth. All said, a date graph is easy in one sense and complex in another sense.
An example code fragment illustration follows:
/* Start of Illustration Code Fragment */
|
The code fragment above can be inserted into the illustration code section of the Illustration project for an immediate running Cocoa application. For additional information consult the Illustration section.
A date graph scales from fractional seconds to millennia and formats accordingly. There is some explicit scale information in its display. For example, you cannot interpret seconds whole numbers as MM/DD/YYYY values.
The following table defines the dictionary key and value pairs:
| Chart Specific Entries | |
| Key | Value Description |
| chart_type¹ | The string date, indicating a date graph. |
| chart_subtype¹ | The string linear. |
| chart_format_type¹ | One of the strings {default, alternate}. |
| title | The main title of the graph. If this key is not present then the template's title is used. |
| x_title | The x title of the graph. If this key is not present then the template's x-title is used. |
| y_title | The y title of the graph. If this key is not present then the template's y-title is used. |
| data_I | A white space delimited list of values representing the x and y values of points in a sequence for curve index I where I starts at 1. The x values are in units of seconds from 1970 and the y values are unitless. See Data Oriented keys for additional information and keys. |
| line_color | A hex encoded representation of a RGBA color value for the line color. If this key is not present then the color table template is used. |
| start_period_seconds | The seconds that corresponds to the left boundary of the PVS_period_graphic. If this key is not present then 28800 (8am) is used. If the value is sunrise then the seconds at sunrise is used. |
| end_period_seconds | The seconds that corresponds to the right boundary of the PVS_period_graphic. If this key is not present then 18000 (5pm) is used. If the value is sunset then the seconds at sunset is used. |
| templates | A custom Templates directory. |
¹ Do not include this key value pair in the Interface Builder Plugin Inspector input string. It is included for you automatically.
Note: The main title is aligned to the left and the x-axis title is turned off in the template. If you need different results you must modify the template.
If you incorporate this functionality into your own application then please consult Cocoa Programming. If you incorporate this functionality into CLI scripts then please consult Script Programming.
You can also modify the following Templates:
| Template Document Names | |
| Template | Description |
| PVST_Date_Chart | Forms the static attributes for this chart type. |
| PVST_2Y_Date_Graph | Forms the static attributes for a two y-axis graph. The y-axis can be of any type (linear, log, etc.) that can be made in a template. |
| PVST_date_color_table | Forms the line colors for odd format type indices. |
| PVST_date_color_table_1 | Forms the line colors for even format type indices. |
This Date graph image maker inherits the Vvidget prototype definitions of the Line Graph image maker. In addition, the following are vvidget name components in the template that can be used to adjust graphical attributes of the respective parts specific to a date graph.
| Vvidget Names | |
| Name | Description |
| PVS_period_graphic | The optional period graphic prototype (usually a rectangle). If this graphic is present then it will be repeated across the graph. The width of each repetition is defined by the start_period_seconds and end_period_seconds keys. The period is modulo one day. This graphic prototype must reside on the graph's (foreground) data layer. |
| PVS_start_date_label | The optional start date text graphic (a Label graphic). Is present, the start date of the graph is inserted in the text of this graphic. This date is often useful when the graph only shows a few hours because the labels are formatted in hours:minutes:seconds and there is no absolute date information presented otherwise. |
| Please help improve this documentation. If a section is hard to understand, there is a typo, you would like a new section added, or you detect any other improvement that can be made then please email support@vvi.com with your information. |