The Error Bars task helps make an error bar graph. Enter the data according to the following table.
| Column Name | Explanation |
| X Values | The x-value for the data point and error bars. The data and error bar x-position are always identical. |
| Y Values | The y-value of the data (the y-location of the green dot) |
| Y-Delta Min | The length from the y-value of the data point to the lower part of the bar (the distance between the green dot and the blue bar). |
| Y-Delta Max | The length from the upper part of the bar to the y-value of the data point. (the distance between the red bar and the green dot). |
Some things to note about this task are:
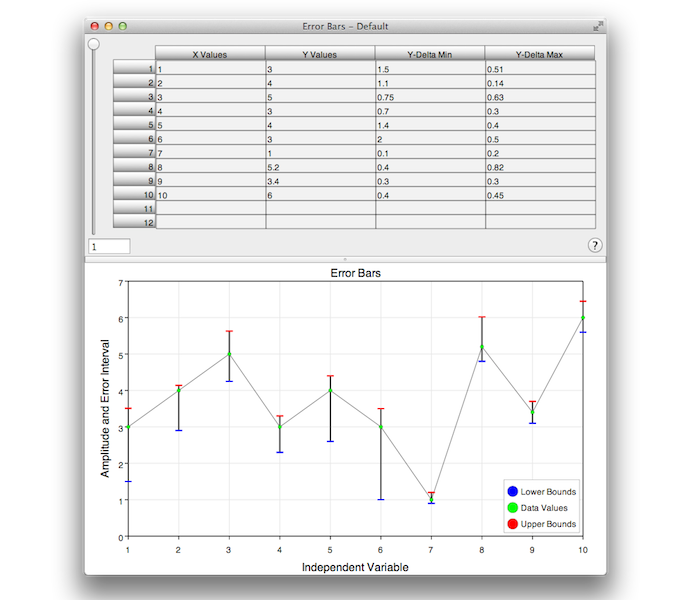
The figure below shows the error bar task.
The Trends setting in the Preferences places trend lines based upon all y-value sets so is a convenient way to observe a trend deviation interval.