Graph IDE ► Data Graphics ► Point Map
a.k.a.: Heat Map, Image Map and Vector Field
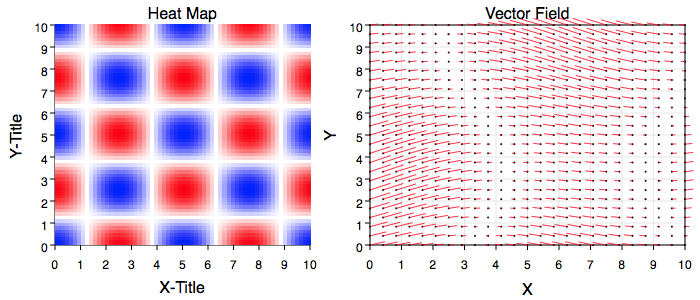
A Point Map is a sequence of x-contiguous values arranged as a matrix that is mapped to a regular grid of cells. The values can be either an amplitude or an amplitude and direction pair. The figures below shows two example point maps.
The vector field is shown with the point tag marker, a small dot, on. The direction of the vector is away from the dot. The dot is somewhat superfluous as the data is on a regular grid and the origin of the vector is easily determined visually. Sometimes a vector field is shown with an arrow at the end of the vector but in this implementation that is not the case as the dot provides a better visual of direction. For dense data it might be advisable to turn the dot off.
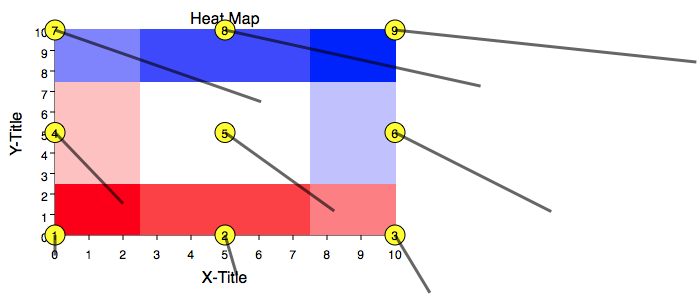
The figure below shows a low-sampled point map graph of nine values on a 3x3 grid. The values are amplitudes {1 2 3 4 5 6 7 8 9} and direction (angles) {-90 -80 -70 -60 -50 -40 -30 -20 -10}. It is low enough so you can see the edge cells are half cells, the corner cells are quarter cells, the interior cells (one in this case) are full cells, the dot is at the cell center and the vector origin is at the center of the cell. The dot sequence index shows the x-contiguous nature of the data representation. The edge and corner truncated cell areas are needed in order to make the cell pattern line up exactly with the x and y minimum and maximum entered into the inspector editor. Notice how the vector length corresponds to the color mapping.
Some standard operations are itemized below.
Data Editor
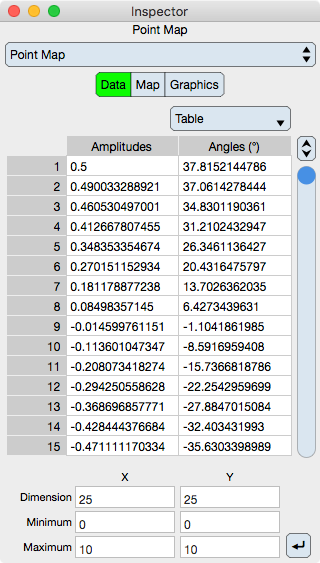
The Data Editor for the Point Map is shown below.
Table
Table controls are described in the Tables section.
The rows represent amplitude and angle values at a particular cell. When in atomic mode, each cell shows the amplitude followed by an optional angle value. When in component mode, the first column shows the amplitude values while the second column shows the angle values. In each case, angle values are optional and need not display if not entered. The angle is always input in units of degrees with origin y = 0, x > 0 and counterclockwise positive value orientation.
Angles are optional. If they are not present then the graphic represents a heat map. If they are present then the graphic represents a vector field map. The vector field ray origins are the center of the cells.
Grid Values
The data table does not specify grid parameters, it only specifies amplitude and angle values. That is because a point fill map is on a regular grid. A regular grid is defined by the six values described below.
Dimension : The number of cells in the x and y dimension, aka: The dimensions of the matrix of values. The product of x and y dimensions should equal the number of rows in the table.
Minimum : The x and y minimum of the grid.
Maximum : The x and y maximum of the grid.
Notice that cell center points, which is also considered where the data is on the grid, are coincidental with the grid minimum and maximum. As a result, the cells along the boundary are actually half cells and at the corners quarter cells. This is a very slight but important distinction.
Apply : Once the grid values have been entered then click the Apply button to redefine the grid.
Map Editor
The Map Editor for the Point Map is shown below.
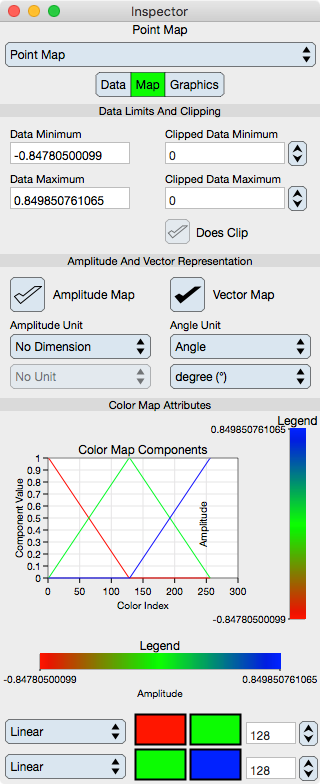
Data Limits And Clipping
The color map spans the data unless it is clipped. Clipping is useful for two reasons: (1) clipping to an interval outside the data values extremum rounds the map to designated values and (2) clipping to an interval inside the data values extremum clips the map itself which is useful to see thresholds of the data.
Data Minimum : Shows the minimum amplitude of the data.
Data Maximum : Shows the maximum amplitude of the data.
Clipped Data Minimum : Defines the minimum value to clip the color map at.
Clipped Data Maximum : Defines the maximum value to clip the color map at.
Does Clip : Clips the color map to the clipping values.
Amplitude And Vector Representation
Amplitude Map : Select this to turn on the color map.
Vector Map : Select this to turn on the vector field.
Amplitude Units : Sets the units of the amplitude of the point map. Note that this unit is orthogonal to the graph units. See Unit Selector.
Angle Units : Sets the units of the angles of the vector field. This unit should typically be in units of degrees of an angle since that is the data input unit of the angles but can be any unit as it is reinterpreted by the user. See Unit Selector.
Color Map Attributes
The color map is further described in the Color Map section.
Graph : Shows a graph of the color map. This graph can be drag and dropped to the graphic view although the legend maps are probably more appropriate to describe the color map.
Legend : Shows a fill representation of the color map in both vertical and horizontal orientation. The independent variable of the graph (x-axis for horizontal and y-axis for vertical) is that of the point map color interpretation. These legends can be dragged to the graphic view as needed. Since the legends are also Point Map graphics they can be independently altered once dragged to the graphic view in accordance with this section of the manual.
Note that if the legend is dropped then its graph independent variable extremum should probably be reset to a rounded value.
Function : Select this to set the color map function. Typically it is set to linear.
Start Color : Defines the start Color of the color map.
End Color : Defines the end Color of the color map.
Number : Defines the number of samples in the color map.
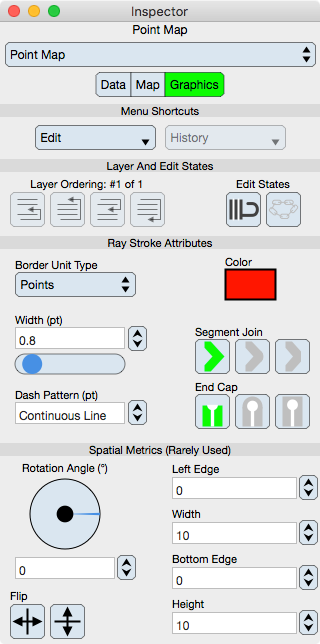
Graphics Editor
The Graphics Editor for the Point Map is shown below.
Common Controls
Controls common to all graphics are described in the Graphics section. Notice that the point fill can affine transform in the usual way. That transform is graphical and will not effect the data and as a result the data and graphic will be out of synch.
Point Map Specific
Stroke : The stroke relates to a vector graph rays.
Spatial Metrics
These spatial metric controls are described in the Graphics section. However, be aware that if they are used then the graphical-spatial coordinates will be out of synch with the data grid whose values are set in the Data editor. Setting grid spatial values (minimum and maximum) will update the graphic spatial values; however the converse is not true.