Graph IDE ► Draw Attributes ► Sequence Colors
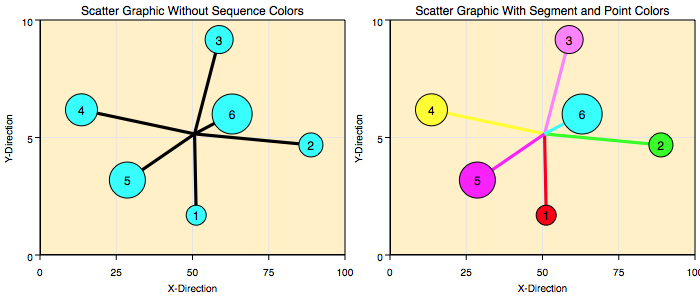
Colors that are an element of a sequence are called Sequence Colors. The figure below shows a scatter graphic with and without sequence colors.
Sequence Colors are implemented in many ways as described in the following table.
| Component | Description |
| Segments | The Scatter, Function, Trajectory and 3D Scatter graphics are defined by a sequence of points that can be connected by a line or spline segment. Each of those segments can be given a color. |
| Markers | The Scatter, Function, Trajectory and 3D Scatter graphics are defined by a sequence of points and each of those points can be delineated by a marker (another graphic). The marker can be given a unique fill color for each point in the sequence. See the Point Tags inspector editor and its color tab for additional information. |
| False Color Maps | The 3D Point Map graphic is defined by a sequence of z values mapped onto a regular grid. That grid defines connected cells (surface) where the cells are ordered and form a sequence. Each cell can take on a different color as defined by a false color map. |
Sequence colors are entered using a Table where each cell in the table shows a color value in rgba numeric representation which are four numbers between zero and one representing the red green blue and alpha values of the color. The alpha is the level of opacity (1 being opaque and 0 being transparent).