Graph IDE ► Overview ► Navigator
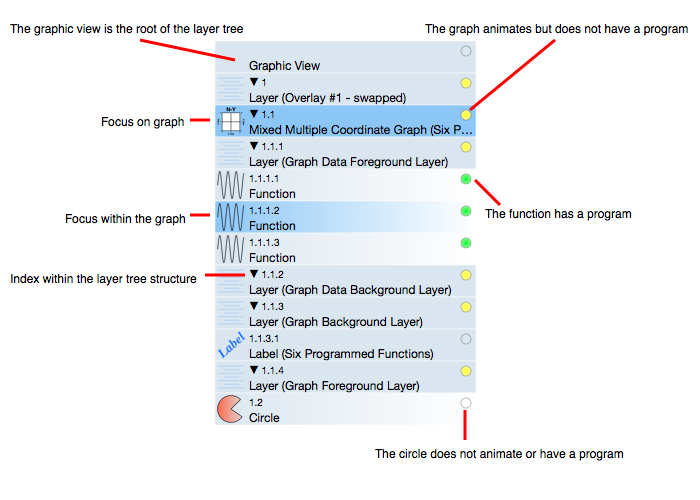
The navigator shows and helps navigate the Layer structure of a document. An example is diagrammed in the following figure.
Formally speaking, the navigator traverses the layer tree structure of a document contents and maps the tree nodes into a sequential (linear) format. The tree starts at the Root Layer, descends through branches and ends up at leaf nodes. It displays each node as a rectangular region with descriptions of several attributes of the nodes as listed in the following table.
The order of each node within a layer is considered a z-buffer and as such is user specified. That means that the navigator order for nodes in a specific layer may not have a specific order. If you apply a Layer sorting of Natural then the navigator order will correspond to left to right and then top to bottom page view ordering thus scrolling down the navigator is akin to scrolling down the main graphic view.
| Attribute | Description |
| Tree Index | The tree index shows the depth of the node by a period delineator and the sequence index within a layer by the decimal. The number of periods corresponds to the depth within the tree structure. |
| Focus | When graphics are clicked upon and graphs double-clicked then they are focused and defocused. On the graphic view the focus is indicated by red knobs. On the navigator it is indicated by a blue rectangular region (a cell). Clicking on a cell in the navigator focuses the corresponding graphic in the graphic view. Shift-click the cell to maintain the current graphic selection and also add the corresponding graphic to the selection and focus upon it. |
| Node Type | A tree structure has two node types, a branch and a leaf. Leafs are terminal (have no subcomponents) while branches have lists of other nodes either other branches or leafs. For example, a Layer and Group are branches while a Circle is a leaf. Graphs are both leafs and branches. Graphs are leafs because they have content on their own right (draw axes and other things) and branches because they contain layers of data. Leafs are indicated by a gradient fill in a rectangle while branches are a solid fill color. In the Navigator, the rectangular region of a node reference is called a cell. |
| Program | Any node can be Programmed and the program is specified on a node basis. That is unlike other programming models (textual based) that are specified linearly (in a source code file). Because a program is node based it is difficult to know which nodes will execute when a document is animated. To solve this problem, each node in the navigator contains a circle. A green circle means the node contains a program that will be executed, a yellow circle means the node will be executed but does not contain a program and a hollow circle means the node does not animate. For example, a graph can animate its data layers and autoscale without containing source code. |
| Collapse/Expand | If a node is a branch node then it can be collapsed and expanded by clicking on its tree index. If collapsed, that node will not show its subnodes in the navigator. |
| Scroll | The navigator is located in a scroll view so it can be panned up and down to locate a node. |
| Exception Nodes | There is a one-to-one mapping between the Layer structure and the navigator cells, except for the following two exceptions: (1) the Root Layer is substituted by a Graphic View reference. That is because the Root Layer is inaccessible to the user and serves only to start the tree structure while the Graphic View is editable via its inspector and (2) some nodes, specifically the background grid and rectangle, are programmed as non-editable and those nodes do not appear in the navigator. |
In Graph IDE nodes (a.k.a.: graphics) are constructed using the many techniques of mouse clicks, palettes, programming, wizards (chart tasks) and other methodologies. The graphics are focused, defocused, edited directly and indirectly. The navigator adds another tool to facilitate the visualization and traversal of the network (tree structure) of nodes displayed in the graphic view of the document. The navigator should be used in tandem with other methods of navigation and visualization. For example, when a graphic is clicked upon in the graphic view its node in the navigator is scrolled to. There is no need to manually (directly) scroll the navigator. When a Group graphic is clicked upon it is focused and its components can be edited in the inspector as a group but components can not be focused and edited individually. The navigator can be used to focus on a component of a group to edit that component directly. Without the navigator, the group is treated as a single entity and the only way to work with components individually is to ungroup the group, work with the component and then regroup the components.
The navigator also gives feedback regarding the focus and traversal through the network of graphics. In that way, the navigator augments the primary way of dealing with graphics and probably should not be used as a primary way to navigate the graphics on a graphic view.