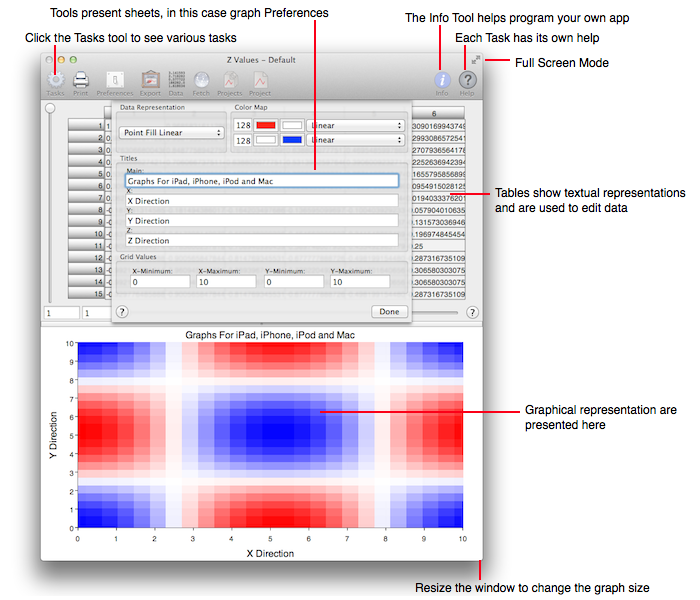
The figure below diagrams Graph's interface. It is a single window with access to various tools, in a toolbar, at the top of the window. The main portion of the window is comprised of a table, which shows the numeric representation, and the graph, which shows the graphical representation. You can hide the toolbar, graph or table by using the normal toolbar hide button (upper right of window) or the split view slider. Thus you are able to focus on the major component you desire, and then defocus to use auxiliary facilities. The figure below shows the Preference tool in a sheet. All tools are implemented as sheets because they are thought of as momentary access to auxiliary features that are not part of the main purpose of Graph. Tools are described in the Tools section, graphs are described in the Tasks section and tables are described in the Tables section.
Notice, for example, that you will not be able to find a direct link to the explanation of a "line graph". That is because tasks are oriented to working with types of data, not types of representations. A "line graph" plots 2D Points so for that see the Set Of 2D Points task and choose the "line graph" from its Preferences tool. Likewise for other representations. See the Tasks and Representations sections for further relationships between data type (tasks) and representations.
Probably the best starting point for learning how to use Graph is to actually use graph. However, if you wish to read about using graph then perhaps a good starting point is the tutorial Enter Data.