Graph ► Tutorials ► Making A Bar Chart
Note: this describes data entry with the Text Edit tool only available in Developer Mode. For normal entry see the Table Editor section.
The following is a continuation of the question posed in Making A Line Graph. This tutorial answers the second part of the question, how to make a bar graph from the data. The following are step-by-step instructions.
1. On your iPad, touch the Graph application icon to launch it.
2. Make sure the Graph application is on the Home page. To do this, touch the upper left navigation button until no buttons appear there.
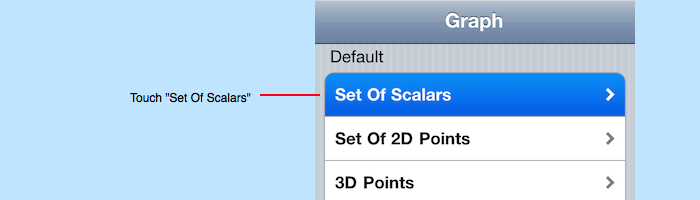
3. On the home page touch the "Set Of Scalars" task to navigate to the Set Of Scalars task.
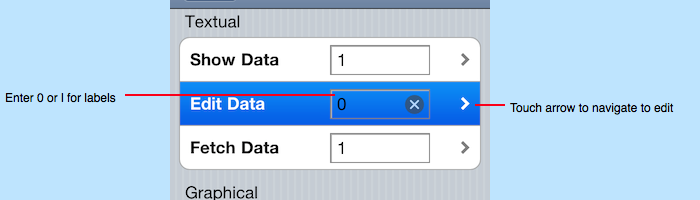
4. On the resulting page, touch "Edit Data" to navigate to the Edit Data tool.
5. You will see a bunch of numbers. Touch any number once. That brings up the keypad. Double-touch to the right of any number (in a blank area). That brings up a menu of options.
6. Touch "Select All" from the menu.
7. Touch the Delete key on the keypad (it looks like a box with a arrow on the left and an X in the middle).
8. Enter your numbers using the keypad. The numbers are consecutive numbers, one number per line, which represents the height of a bar. In your case, enter 10 lines of data where each line consists of one number which is the dollar value (without the dollar symbol and without commas) for example:
232

8568

2343

23

88

987

984

23

899

444
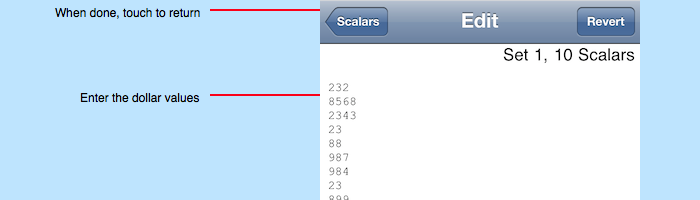
9. Touch the "Scalars" button on the upper left of the page. That will enter your data and also return to the "Set Of Scalars" task page.
10. Touch the "Bar > Offset > Half" table row on that page.
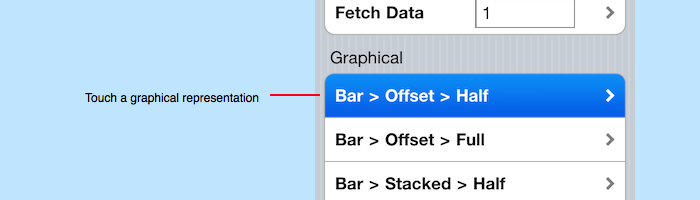
11. That will navigate to a bar chart representation of your data on a linear coordinate system.
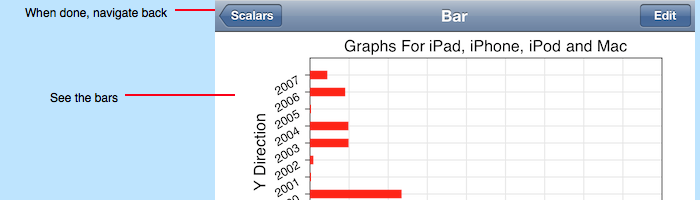
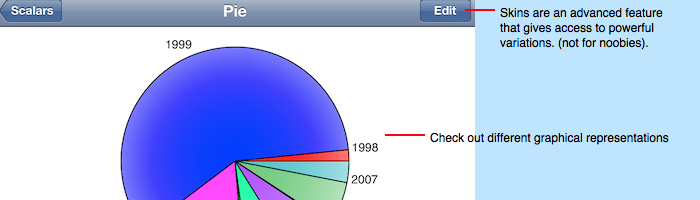
12. If you want to see your data on a different coordinate system then touch the "Scalars" button on the upper left of the page and then touch another table row in the Graphical section. For example "Pie Chart" to see your data in pie chart form.
13. Notice how the bars align to integers on the axis. Now you need to figure out how to get the axis to display years. For that, navigate to the "Set Of Scalars" task page by touching the "Scalars" button on the upper left of the page. Then in the "Edit Data" row touch the text field that currently has the numeral 1 in it. Use the keypad to change that to the letter l or the number 0 and then touch the "Edit Data" row or the arrow to the right in that row. You will now be able to edit the axis labels.
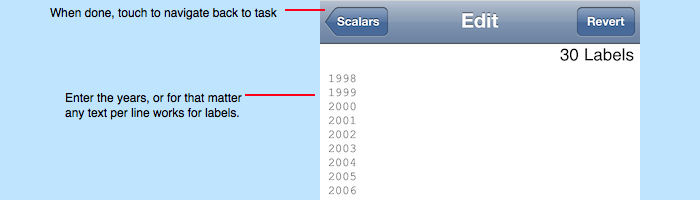
14. As before, touch any label once, double-touch to the right of any label, touch "Select All" from the menu, touch the Delete key on the keypad, and then enter the years like this:
1998

1999

2000

2001

2002

2003

2004

2005

2006

2007
The result is shown below. Note that you can enter any label you wish, not just numbers. Each label is entered as one line of text.
15. Touch the "Scalars" button on the upper left of the page. That will enter your labels and also return to the "Set Of Scalars" task page.
16. Then touch one of the graphical representations and notice how with a bar chart the y-axis has the year labels, with a column chart the x-axis has the year labels and with a pie chart the labels are placed near each wedge. The pie chart only looks right in landscape orientation.
17. If you want to add another group of bars on the graph then enter 2 in the text field in the "Edit Data" row of the task and then touch the arrow to the right of it and enter the scalars for the 2nd group of bars. Then navigate back to the task page and view the graph. The graph will now display two groups of bars either in offset or stacked format. Repeat for bar groups 3 through 20.
Conclusion
The key to using the navigation system effectively is to recognize these properties:
This tutorial explained how to enter data directly on your iPad and iPhone and how to use the default layouts. Using other tools and skins permit a larger variation and more effective data importing.