
Graph ► Tutorials ► Making A Line Graph
Note: this describes data entry with the Text Edit tool only available in Developer Mode. For normal entry see the Table Editor section.
The support section Enter Data gave some pointers on how to enter data but was not a step-by-step explicit instruction on that subject whereas this section is.
The following are the instructions for a line graph. For a bar chart see the tutorial Making A Bar Chart. The figures are on an iPhone, but are equally applicable to an iPad.
1. On your iPad, touch the Graph application icon to launch it.
2. Make sure the Graph application is on the Home page. To do this, touch the upper left navigation button until no buttons appear there.
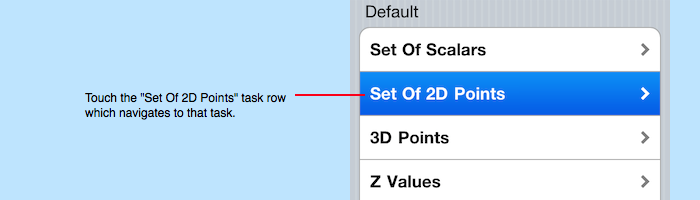
3. On the home page touch the "Set Of 2D Points" task to navigate to the Set Of 2D Points task.
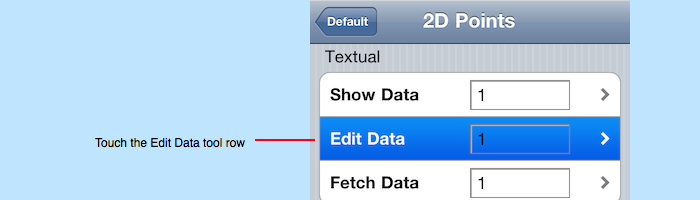
4. On the resulting page, touch "Edit Data" to navigate to the Edit Data tool.
5. You will see a bunch of numbers. Touch any number once. That brings up the keypad. Double-touch to the right of any number (in a blank area). That brings up a menu of options.
6. Touch "Select All" from the menu.
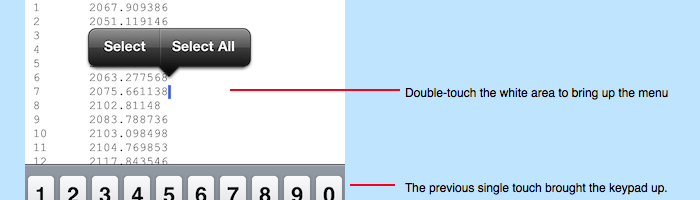
7. Touch the Delete key on the keypad (it looks like a box with a arrow on the left and an X in the middle).
8. Enter your numbers using the keypad. The numbers are consecutive x y pairs of points, one point per line. In your case, enter 10 lines of data where each line consists of two numbers where the first number is the year and the second number is the dollar value (without the dollar symbol and without commas) for example:
1998 232

1999 8568

2000 2343

2001 23

2002 88

2003 987

2004 984

2005 23

2006 899

2007 444
The result looks like the following:
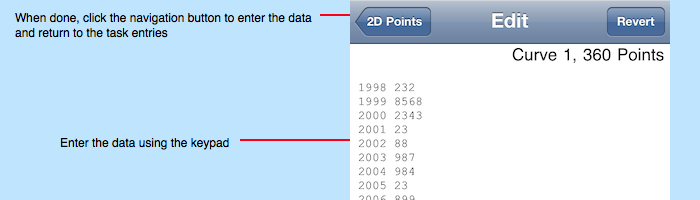
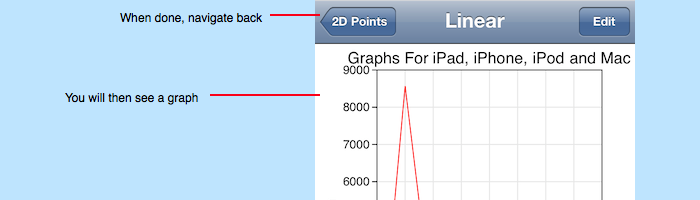
9. Touch the "2D Points" button on the upper left of the page. That will enter your data and also return to the "Set Of 2D Points" task page.
10. Touch the "Curve > Linear" table row on that page.
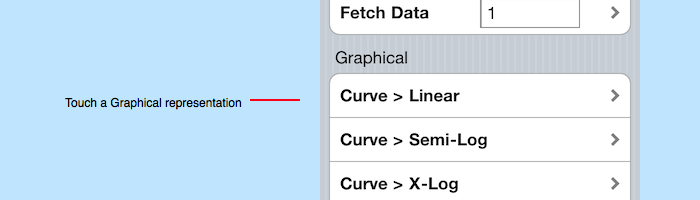
11. That will navigate to a line graph representation of your data on a linear coordinate system.
12. If you want to see your data on a different coordinate system then touch the "2D Points" button on the upper left of the page and then touch another table row in the Graphical section. For example "Curve > Semi-Log" to see your data on a semi-log graph, or "Area > Linear" to see your data as an area graph.
13. If you want to place another curve on the graph then enter 2 in the text field in the "Edit Data" row of the task and then click the arrow to the right of it and enter the points for the 2nd curve. Then navigate back to the task page and view the graph. The graph will now have 2 curves on it. Repeat for lines 3 through 20.
After experimenting in the Set Of 2D Points task you can proceed to the Making A Bar Chart tutorial to see the rest of the answer.