Graph IDE ► Data Graphics ► Bar And Column Chart
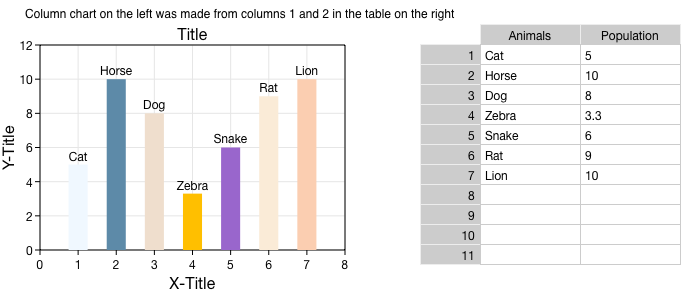
A Bar or Column Chart is a Group of Rectangles and Labels that is created using a Spreadsheet. The figure below shows a column chart.
A column chart shows scalar amplitudes by adjusting the height of rectangles while a bar chart shows scalar amplitudes by adjusting the width of rectangles. When the distinction between the height and width is immaterial then the bar or column chart is simply referred to as a bar chart, thus making the bar nomenclature generic, and either width or height is referred to as length.
A bar or column chart can be constructed manually by creating rectangles and labels, aligning them appropriately and then grouping them. However, it is easier to use a Spreadsheet to create a bar or column chart.
When data in the spreadsheet is changed then the spreadsheet will also change the column or bar chart. If the spreadsheet that made the column or bar chart is deleted then the column or bar chart will still operate as a column or bar chart, but data derived properties such as rectangle lengths will need to be adjusted manually. For that reason, the spreadsheet should probably not be deleted unless the column or bar chart data is static. If the column or bar chart is ungrouped then the column or bar chart feature is deleted.
The column or bar chart group subgraphics (elements) can not be altered directly but the Graphic Navigator can be used to select an element of the group and then that element's attributes can be modified. When the data in the spreadsheet is modified then the column or bar chart will be updated and the existing element attributes will be maintained.
Note that it only makes sense to make a bar chart on a rectilinear coordinate system. There is no provision for other coordinates.
Arranger Editor
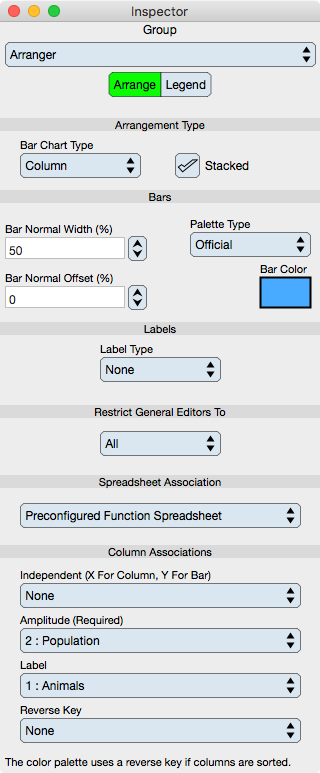
A bar chart is a group with a specific arranger so that the main inspector editor for a bar chart is the Group inspector editor. The Arranger sub-editor is where the bar chart specific controls are and is described below.
Note: If you ungroup the bar chart elements then its arranger is dereferenced and deleted. If you then group those same elements then the arranger is the Alignment editor for a general group.
Arrange
The Arrange controls modify bar chart specific arrangement of the bars and labels.
Arrangement Type
Bar Chart Type : One of Column or Bar. When Column then the Independent axis is the X-Axis. When Bar then the Independent axis is the Y-Axis.
Stacked Bars : When selected then the bars are stacked against the previous bar group, if any. Stacking means that the data values are relative to the previous bar group data values and that the stacked bar width (or height for column charts) is cumulative.
Note that if the independent variable is categorical (textual or date formatted) then if there are repeated category values then the spreadsheet algorithms will stack the repeated values within one data set (column). This is different than the Stacked Bars setting which stacks relative to the previous and separate data set (column).
Bars
Bar Color : Specifies the uniform color of each bar. Generally, a uniform color is suitable for stacked bars and non-uniform colors are suitable for categorical bars. Uniform colors may also be desired when the bar element is referenced to a label.
Palette Type : When selected then the colors assigned in a palette as define in the Color Selector section are used. You may wish to set this control to None and then modify each bar color individually by choosing that bar within the Navigator. Modifications to the graphics of each bar will be maintained when the data is changed.
Bar Normal Width : Specifies the width of the bar relative to adjacent bars. This works best when the bar placement is uniform but if the placement is not uniform then the minimum adjacent distance is used.
Bar Normal Offset : Specifies the offset of the bar relative to adjacent bars. This works best when the bar placement is uniform but if the placement is not uniform then the minimum adjacent distance is used. Note that offset is intended to be used when stacking is off. Stacking is an accumulative effect, while offset is an absolute effect.
Labels
Label Type : The label can be automatically generated by using a specific type. If None is selected then the column associated with the Label (if any) is used. If Amplitude or Sequence is selected then the bar value or sequence index is used. If the Label column is also chosen then the Amplitude value or Sequence index, prefixed by a space and enclosed in parenthesis, is appended to the Label.
Restrict General Editor To
The main editor which is the Group Editor will operate on all components of the bar chart unless restricted by this control. There are many uses for this restriction, for example to provide a fill background for the labels, but not the bars; to provide a gradient to the bars but not the labels; to turn the bar boundary stroke on or off or change its color without effecting the labels; or a whole host of other uses.
Spreadsheet Association
Defines and selects the spreadsheet used to generate the bar chart. Any spreadsheet can be choose but that spreadsheet should conform to the intended use. When different spreadsheets are chosen then all representation parameter values are maintained so that this is a good way to flip through alternative data sets while maintaining the bar chart graphical attributes.
Column Associations
The column associations are set during representation creation but can be reset here. Choosing different columns are a good way to quickly view different data sets for one bar chart.
Independent : Specifies the column to associate with the independent dimension (the x-axis for column charts and the y-axis for bar charts). If None then the independent variable is unitized. Note that the independent variable type can be a scalar, date or text. In the case of date or text then the variable is considered categorical; while scalar data is considered ordinal. This distinction allows for stacked bars within one data set when the type is categorical since one category can have duplicate entries.
Amplitude : Specifies the column to associate with the bar length (height for column charts and width for bar charts).
Label : Specifies the column to associate with the label entries. If None then no labels are used. The labels appear adjacent to the bar maximum length.
Reverse Key : Specifies the column to associate with reverse keys to external elements such as the color palette. If the table is not sorted then this key is not needed. Sometimes, a sort is performed where external element order association need not be maintain in which case this reverse key is not needed.
Legend
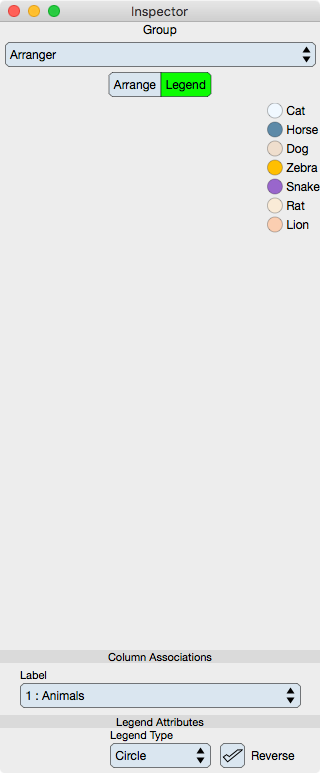
The legend tabloid shows a pre-built legend of the bar chart. It is based on the colors of the bars and the column associated with the legend labels.
Note that there are two possible legends of interest. If there are more than one bar grouping then the bar chart is either an offset, stacked or overlaid bar chart. In that case the Graph legend may be appropriate because that legend is specific to data elements of the graph and not elements of each bar grouping.
Legend
Legend Group : The legend is a Group Graphic and is built automatically using the attributes specified below. Once the attributes below are specified then drag the legend near your bar chart on the document's Graphic View as it is also an element of a Palette. The legend is set to drag and drop to the overlay layer of the graphic view.
When the legend is dropped onto the graphic view then it is also connected to the spreadsheet associated with the bar chart. Changing the bar chart colors or spreadsheet label column will also change the legend. The legend is a group graphic which means it has an arranger (just like the bar chart). That arranger is accessed via the group editor subeditor.
Legend Attributes
Legend Type : Either Circle or Square. If circle or square then the legend marker is represented by a circle or rectangle respectively whose fill color is that of each bar chart bar section.
Reverse : The row order of the legend is same as the row order of the data. Select Reverse to reverse that order.