Graph IDE ► Data Graphics ► Pie Chart
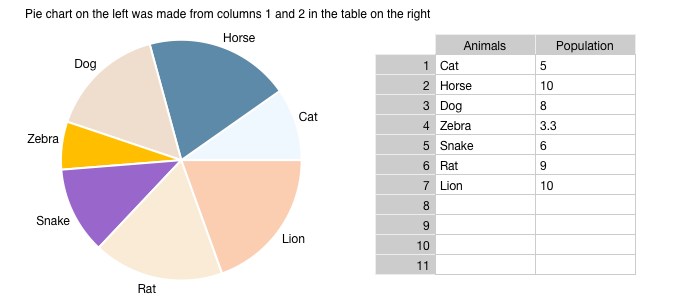
A Pie Chart is a Group of Circles and Labels that is created using a Spreadsheet. The figure below shows a pie chart.
Each wedge section of the pie chart represents the portion of the data values (amplitudes) in the spreadsheet.
A pie chart can be constructed manually by creating circles and labels, aligning them appropriately and then grouping them. However, it is easier to use a Spreadsheet to create a pie chart.
When data in the spreadsheet is changed then the spreadsheet will also change the pie chart. If the spreadsheet that made the pie chart is deleted then the pie chart will still operate as a pie chart, but data derived properties such as the wedge angles will need to be adjusted manually. For that reason, the spreadsheet should probably not be deleted unless the pie chart data is static. If the pie chart is ungrouped then the pie chart feature is deleted.
The pie chart group subgraphics (elements) can not be altered directly but the Graphic Navigator can be used to select an element of the group and then that element's attributes can be modified. When the data in the spreadsheet is modified then the pie chart will be updated and the existing element attributes will be maintained.
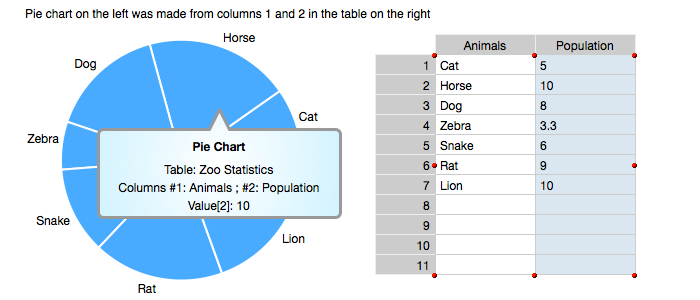
Information Selector
When the Spreadsheet is made Active then all the associated graphics are also made active which means they will show the Information Selector when hovered over and when a wedge element is selected then a Data Selector comes forward to change that wedge amplitude which will also change the spreadsheet value. An example is shown in the following figure.
Arranger Editor
A pie chart is a group with a specific arranger so that the main inspector editor for a pie chart is the Group inspector editor. The Arranger sub-editor is where the pie chart specific controls are and is described below.
Note: If you ungroup the pie chart elements then its arranger is dereferenced and deleted. If you then group those same elements then the arranger is the Alignment editor for a general group.
Arrange
The Arrange controls modify pie chart specific arrangement of the wedge sections and labels.
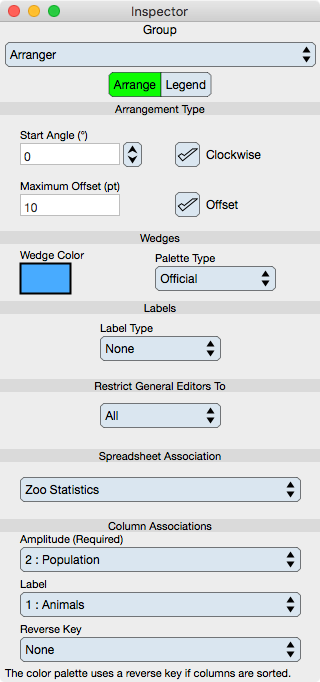
Arrangement Type
Start Angle : By default, the pie sections start at angle zero from the y=0, x-positive ray and proceed counterclockwise. This default is consistent with the mathematical representation, but may not reflect classical usage. Modify the start angle as needed. A typical domain-specific start angle is 90 degrees which means wedges begin a the x=0, y-positive ray.
Clockwise : By default, the pie sections are sequenced in ascending angle counterclockwise. Select this button to order clockwise. A counterclockwise representation is more formal, however a clockwise representation is more consistent with traditional usage in many domain-specific applications.
Maximum Offset : Defines a radial offset of the maximum-value wedge.
Offset : When selected, the maximum-value wedge is offset from the origin (center) of the pie chart by the value in the Maximum Offset field.
Wedges
Wedge Color : Specifies the uniform color of each wedge.
Palette Type : When selected then the colors assigned in a palette as define in the Color Selector section are used. Choose None in order to break the reference and then use the uniform Wedge Color instead.
You may wish to deselect the Use Palette Colors and then modify each wedge color individually by choosing that wedge within the Navigator. Modifications to the graphics of each wedge will be maintained when the data is changed.
Labels
Label Type : The label can be automatically generated by using a specific type. If None is selected then the column associated with the Label (if any) is used. If Amplitude or Sequence is selected then the wedge value or sequence index is used. If the Label column is also chosen then the Amplitude value or Sequence index, prefixed by a space and enclosed in parenthesis, is appended to the Label.
Restrict General Editor To
The main editor which is the Group Editor will operate on all components of the pie chart unless restricted by this control. There are many uses for this restriction, for example to provide a fill background for the labels, but not the wedges; to provide a gradient to the wedges but not the labels; to turn the wedge boundary stroke on or off or change its color without affecting the labels; or a whole host of other uses.
Spreadsheet Association
Defines and selects the spreadsheet used to generate the pie chart. Any spreadsheet can be referenced but that spreadsheet should conform to the intended use. When different spreadsheets are chosen then all representation parameter values are maintained so that this is a good way to flip through alternative data sets while maintaining the pie chart graphical attributes.
Column Associations
The column associations are set during representation creation but can be reset here. Choosing different columns are a good way to quickly view different data sets for one pie chart.
Amplitude : Specifies the column to associate with the relative wedge arc.
Label : Specifies the column to associate with the label entries. If None then no labels are used.
Reverse Key : Specifies the column to associate with reverse keys to external elements such as the color palette. If the table is not sorted then this key is not needed. Sometimes, a sort is performed where external element order association need not be maintain in which case this reverse key is not needed.
Legend
The legend tabloid shows a pre-built legend of the pie chart. It is based on the colors of the wedges and the column associated with the legend labels.
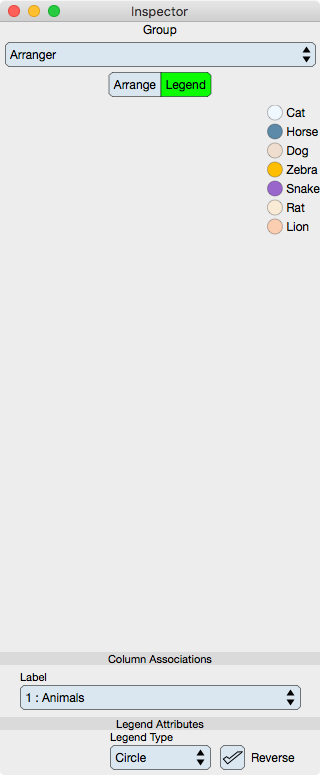
Legend
Legend Group : The legend is a Group Graphic and is built automatically using the attributes specified below. Once the attributes below are specified then drag the legend near your pie chart on the document's Graphic View as it is also an element of a Palette. The legend is set to drag and drop to the overlay layer of the graphic view.
When the legend is dropped onto the graphic view then it is also connected to the spreadsheet associated with the pie chart. Changing the pie chart colors or spreadsheet label column will also change the legend. The legend is a group graphic which means it has an arranger (just like the pie chart). That arranger is accessed via the group editor subeditor.
Legend Attributes
Legend Type : Either Circle or Square. If circle or square then the legend marker is represented by a circle or rectangle respectively whose fill color is that of each pie chart wedge section.
Reverse : The row order of the legend is same as the row order of the data. Select Reverse to reverse that order. This is helpful for many reasons for example, clockwise v.s counterclockwise sequencing of the pie chart data.