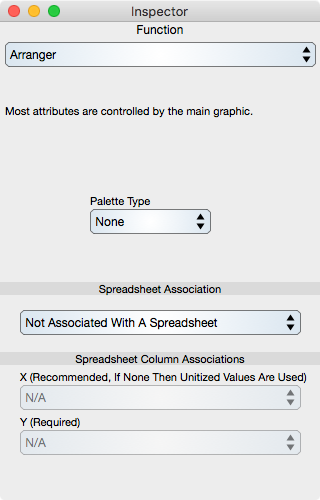
General
Palette Type : When selected then the colors assigned in a palette as define in the Color Selector section are used. Choose None in order to break the reference and then use a uniform color instead.
Spreadsheet Association
Defines and selects the spreadsheet used to generate the function points. Any spreadsheet can be chosen but that spreadsheet should conform to the intended use. When different spreadsheets are chosen then all representation parameter values are maintained so that this is a good way to flip through alternative data sets while maintaining the representation graphical attributes.
When the representation is made without a spreadsheet then it can be later associated with a spreadsheet in order to delegate the constitutive properties of the representation to an external source.
Column Associations
The column associations are set during representation creation but can be reset here. Choosing different columns are a good way to quickly view different data sets for one line graph.
X : Specifies the column to associate with the x component of the data points.
Y : Specifies the column to associate with the y component of the data points.